Inflation remains Steady for Now but Higher Oil Prices are Looming
Peter Bernstein, Chief Economist pbernstein@rcfecon.com, 312-431-1540 x1515
Louise Collis, Senior Economist
March 11, 2026
The Current Situation
The CPI All Items rose 0.3% in February after rising 0.2% in January; year-on-year inflation was unchanged at 2.4%. Core CPI, which does not include food and energy categories, increased 0.2% for the month and was 2.5% for the year. The figures released today were collected before recent gas price increases due to the conflict in Iran.
Our comparison figure today looks a little different, because the July 2022 spike in CPI All Items inflation is swamped by the huge energy price increases following the invasion in Ukraine in February 2022. There were other factors that led to inflation at that time, chiefly the post-pandemic rebound in demand, but energy prices were a big driver. Energy as a final consumer product is not a big part of the CPI – it accounts for about 6.3%. But energy is also an input into many products, and so energy prices feed into inflation in many other goods and services.
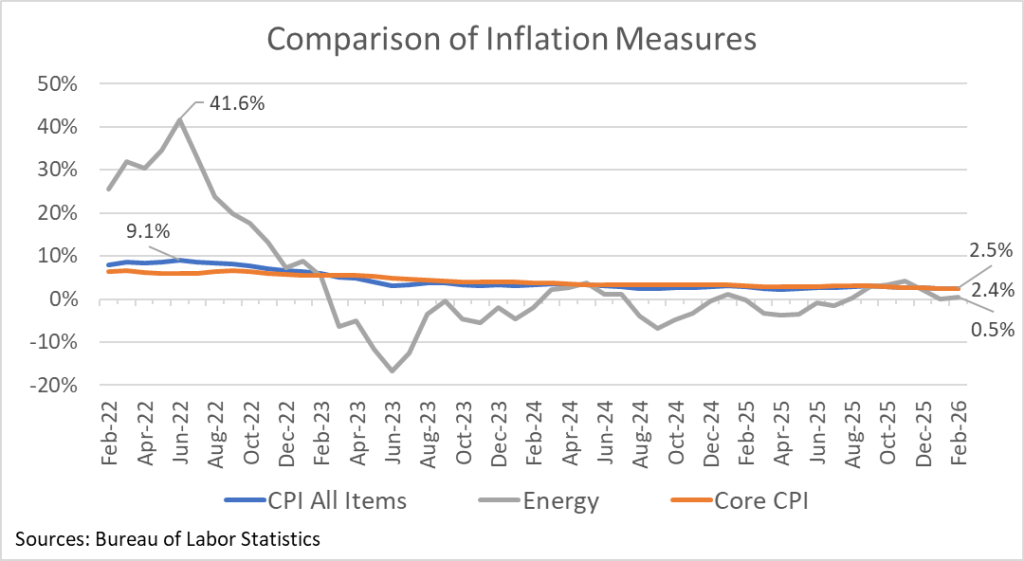
Oil prices have not reached the highs of 2022 – the barrel price for WTI was over $100 from February to August of that year – and governments including in the US will be working to keep prices stable, but even the recent hikes (up to $94.65 last Monday from a low of $55 in December according to the EIA) will show up in higher prices in the future. Even if energy prices spike half as much as they did in 2022, that alone would push March inflation well above 3% year-over-year. The increase may ultimately be short-lived, but consumers will feel the pain for some time at least. Importantly, the increase won’t have much impact on the core inflation measure. That’s a key reason why the Fed prefers core price measures which are less susceptible to these kinds of wild swings.
RCF’s Inflation Scorecard
RCF’s Inflation Scorecard is based on analysis of 20 different price series comprising 98% of the total consumer price index. Each of these price series represents a portion of the CPI based on household spending patterns. For example, food purchased for at-home consumption is about 8% of the typical consumer’s budget; it has a weight of 8.04 out of a total index of 100.
Our scorecard presents two metrics to track month-to-month price increases. The first metric is the share of the index for which inflation in the most recent month is rising (greater than the prior month’s inflation) vs. the share of the index for which inflation is falling (lower than the prior month) or prices fell (deflation). For November, in the absence of most October prices, we judged inflation to be rising if the price rise September to November converted to a monthly figure was greater than the change August to September.
RCF Inflation Scorecard: February 2026
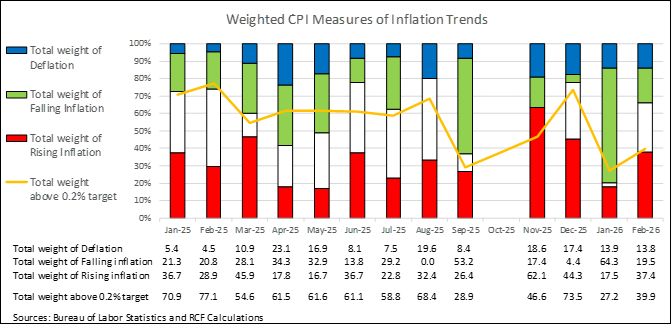
Our first metric shows that 20% of the weighted CPI had falling inflation in February vs January. Another 14% of the weighted CPI saw prices fall in February (deflation). Together 33% of the weighted CPI showed lower inflation or deflation in February. 37% of the weighted CPI showed rising inflation in February, which is higher than average over the last year. The February numbers are also worse than what we saw in January when nearly 80% of the weighted CPI had lower inflation or deflation.
Our second metric shows that 40% of the weighted CPI has monthly inflation above 0.2%, a monthly figure that corresponds to the Fed’s annual target of 2% inflation. This is the fourth lowest share since we began tracking. Taken together, our two metrics show that while February is not as good as January, it still reflects a gradual downward trend in inflation. That’s reason for optimism, were it not for looming energy prices.
Analysis of Individual Components of the Consumer Price Index
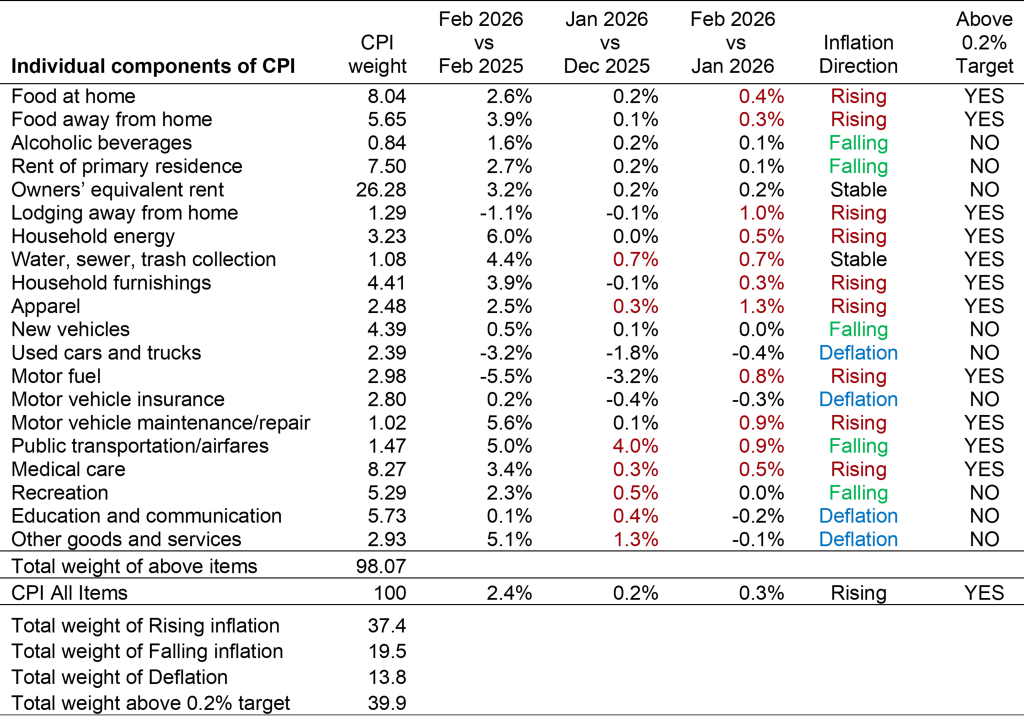
Sources: Bureau of Labor Statistics and RCF Calculations 1. Inflation direction indicates whether monthly inflation in February was higher or lower than monthly inflation in January. Deflation means prices fell in February vs January.
Highlights:
- Food at home prices rose 0.4%, with beef up 14% since last year, and fresh fruits and vegetables increasing 1.7% for the month. Lettuce was up 12% from January to February. Food away from home rose 0.3%.
- Owners’ equivalent rent and rent of primary residence are up 0.2% and 0.1% in February. Shelter makes up over a third of the weight of CPI, and so relief in these categories is important to bringing down inflation. Lodging away from home is up 1% since January but down 1.1% for the year.
- Water, sewer, trash collection and household furnishings prices are both up 4% for the year.
- Apparel, one of the categories flagged as potentially affected by tariffs, is up 1.3% for the month.
- Motor fuel prices rose 0.8% for the month but are down 5.5% from a year ago. Household energy is up 0.5% for the month, and up 6% from a year ago. Taken together, energy is up 0.5% for the year.
- New vehicle prices are flat, while used cars and trucks are down 0.4% in February and down 3.2% from a year ago. Motor vehicle insurance prices rose 0.2% for the year and are down 0.3% since January. That’s a big change from this time last year when insurance prices showed an 11.1% increase from the prior year.
- Medical care is up 0.5% for the month and up 3.4% over the year.
- Public transportation/airfares are up 1% in February and up 5% for the year.