Inflation hits 3-Year High, Largest 2-Month Price Jump since 2022
Peter Bernstein, Chief Economist pbernstein@rcfecon.com, 312-431-1540 x1515
Louise Collis, Senior Economist
May 12, 2026
The Current Situation
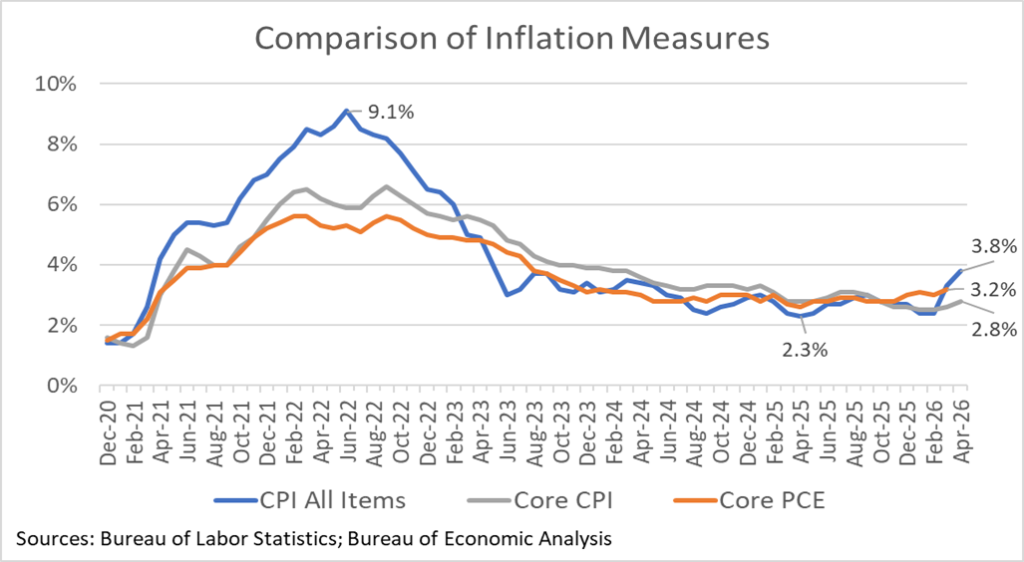
Yikes! The CPI All Items rose 0.6% in April, following an even higher increase of 0.9% in March. The combined increase of 1.5% was the largest two-month jump since the peak inflation in June 2022. Year-on-year inflation rose to 3.8 % – the highest since May 2023. Energy price increases from the Iran conflict are clearly the key driver. However, it is more worrisome to us that Core CPI, which does not include food and energy categories, increased 0.4% for the month and 2.8% for the year. That suggests recent increases in oil prices are starting to show up in other prices as well. Core PCE – the Fed’s current preferred inflation measure – was up 3.2% through March and will likely be higher when its April readings are reported.
Another concern is that for the first time since April 2023, the yearly increase in prices has exceeded the yearly increase in average hourly wages. Fortunately, unemployment continues to remain low and GDP grew a respectable 2% in Q1. That should alleviate some concerns about stagflation and a recession. Even so, inflation heading toward 4% puts a serious strain on household budgets.
RCF’s Inflation Scorecard
RCF’s Inflation Scorecard is based on analysis of 20 different price series comprising 98% of the total consumer price index. Each of these price series represents a portion of the CPI based on household spending patterns. For example, food purchased for at-home consumption is about 8% of the typical consumer’s budget; it has a weight of 8.33 out of a total index of 100.
Our scorecard presents two metrics to track month-to-month price increases. The first metric is the share of the index for which inflation in the most recent month is rising (greater than the prior month’s inflation) vs. the share of the index for which inflation is falling (lower than the prior month) or prices fell (deflation).
Our first metric shows that 66% of the weighted CPI has rising inflation meaning that the April price increase was even higher than the March price increase. That’s the worst monthly reading for this metric in three years. Noteworthy, fuel prices were not part of that 66% as the 5.7% increase in April was less than the 21.5% increase in March, though that’s of small comfort. Just 12% of the weighted CPI had falling inflation in April vs March. Another 13% of the weighted CPI saw prices fall in April (deflation).
RCF Inflation Scorecard: April 2026
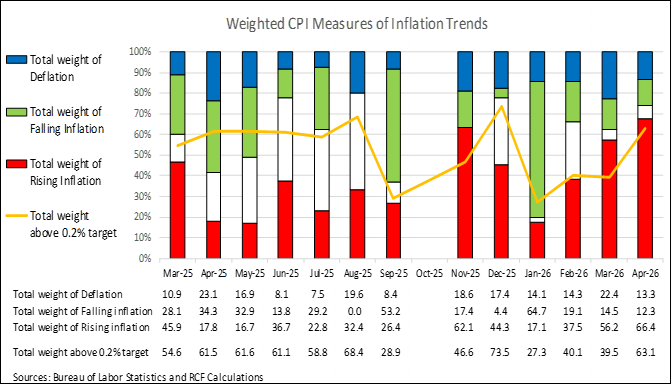
Our second metric shows that 63% of the weighted CPI has monthly inflation above 0.2%, a monthly figure that corresponds to the Fed’s annual target of 2% inflation. That in itself is not a particularly high figure, as we might expect 50% of the CPI to be above the Fed’s target and 50% at or below it. But it is a sharp increase from the 40% share we have seen in recent months, indicating that higher fuel prices are starting to show up elsewhere in the economy.
A key question is whether recent months’ increases are temporary or the beginning of a longer-term upward trend. The 2022 inflation, driven by the post-Covid recovery and the invasion of Ukraine, did not end up being a transitory shock. It would be a mistake to assume that this jump in inflation will reverse itself anytime soon.
Analysis of Individual Components of the Consumer Price Index
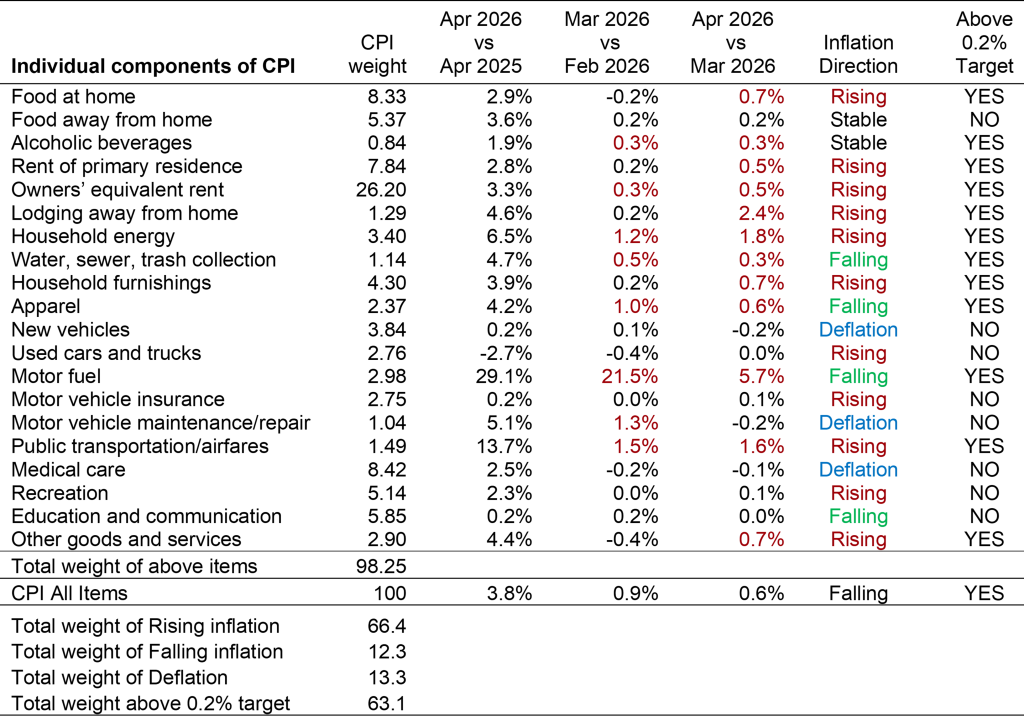
Sources: Bureau of Labor Statistics and RCF Calculations 1. Inflation direction indicates whether monthly inflation in April was higher or lower than monthly inflation in March. Deflation means prices fell in April vs March.
Highlights:
- Motor fuel prices rose 6% for the month and are up 29% from a year ago. Gasoline prices which are an element of motor fuel are up 5.4% seasonally adjusted, but up 11.1% for the month on a non-seasonally adjusted basis because they usually rise in the spring.
- Public transportation/airfares are up 1.6% in April and up 14% for the year. Airline fares are up 2.8% for the month seasonally adjusted, but like gasoline, they typically rise in April; on a non-seasonally adjusted basis, they are up 6.3% for the month.
- Household energy is up 1.8% for the month, and up 6% from a year ago. Energy accounts for about 7% of the typical consumer budget and is up 4% for the month.
- Food at home prices rose 0.7%, with meat continuing to push prices: meat is up 1.8% for the month and tomato prices are up 15% in April and 40% for the year. Food away from home rose 0.2%.
- Owners’ equivalent rent and rent of primary residence are both up 0.5% in April, which may reflect some apparent low increases over the previous six months when data collection was interrupted by the federal government shutdown. Lodging away from home is up 2.4% since March and up 4.4% for the year.
- New vehicle prices are down 0.2%, while used cars and trucks are flat for the month, and are down 2.7% from a year ago. Motor vehicle insurance prices are up 0.1%, and Motor vehicle maintenance/repair is down 0.2% for the month. All good news if you can afford the gas to drive your car.