Inflation’s Slow Decline Continues
Peter Bernstein, Chief Economist, pbernstein@rcfecon.com, 312-431-1540 x1515
The Current Situation
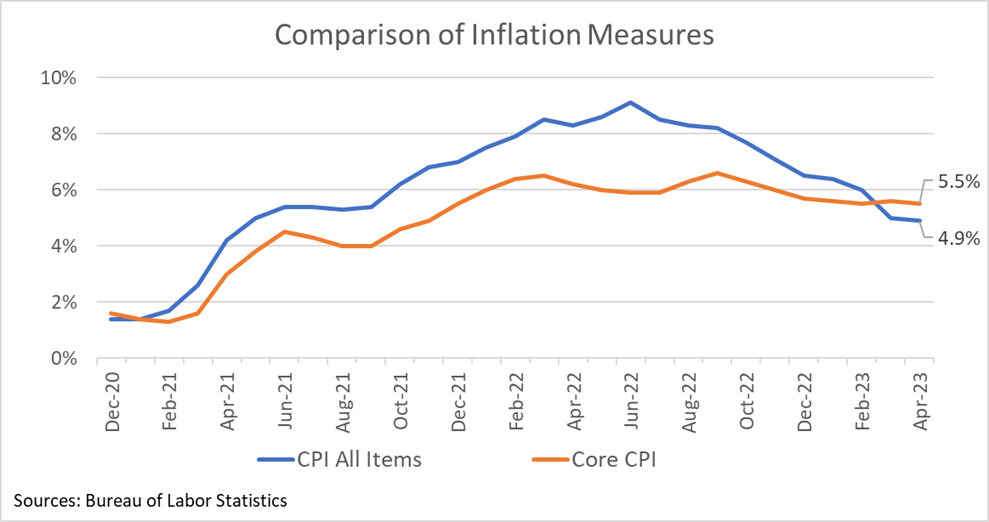
The CPI and core CPI both increased 0.4% in April with their year-over-year rates declining slightly to 4.9% and 5.5% respectively. For what it’s worth, those year-over-year measures are higher due to large increases in prices last May and June. For the last 6 months, annualized CPI inflation is 3.3% while annualized core inflation is 4.8%.
Core inflation is viewed as the better indicator of future price changes. The 0.4% April increase, consistent with the 4.8% six-month core inflation rate, suggests inflation is becoming “sticky,” meaning that rising prices are increasingly embedded in the economy. This should come as no surprise since inflation has been above 4% for the last two years. Thus, price pressures are likely to persist, even after a statistical decline occurs once last May and June’s price spikes roll off the year-over-year inflation calculation.
Even assuming inflation continues its slow decline, it’s beginning to look like the Fed’s 2% goal is a long way off. Bear in mind that the Fed has already raised the fed funds rate by 5% and core inflation has barely declined. For that matter, the Fed’s rate increases haven’t stopped employment from growing or brought on the long-feared recession. With wages now rising as much as prices, and by some wage measures, rising a bit more than prices, the bite from inflation has diminished. All of this suggests that, for better and worse, people are adjusting to a world of higher inflation.
RCF’s Inflation Scorecard
RCF’s Inflation Scorecard is based on analysis of 20 different price series comprising 98% of the total consumer price index. Each of these price series represents a portion of the CPI based on household spending patterns. For example, food purchased for at-home consumption is about 8.7% of the typical consumer’s budget; it has a weight of 8.73 out of a total index of 100.
Our scorecard presents two metrics to track month-to-month price increases. The first metric is the share of the index for which inflation in the most recent month is rising (greater than the prior month’s inflation) vs. the share of the index for which inflation is falling (lower than the prior month) or prices fell (deflation). Because deflation is showing up across more categories, we’ve added a separate measure of the total weight of deflation within the CPI index.
Our second metric is the share of the index for which the most recent month’s inflation exceeded 0.2%, a monthly rate that corresponds to the Federal Reserve’s target inflation rate of 2% per year.
For April, 18.6% of the weighted CPI experienced deflation and another 15.9% showed falling inflation. Taken together, those positive inflation measures roughly match the 34.1% of the weighted index that had rising inflation in April. The rest of the index had stable inflation. The weight of higher inflation in April was much worse than in March when only 15.7% of the index had rising inflation.
The good news is that the share of categories that had April inflation above 0.2% held steady at about 60% of the weighted CPI, well below that 90% readings we saw during the peak inflation periods in May and June of 2022. Thus, the evidence from our April scorecard is mixed — while we are in a better place than we were six or nine months ago, the recent inflation situation has not improved much.
RCF Inflation Scorecard: April 2023

Analysis of Individual Components of the Consumer Price Index

Sources: Bureau of Labor Statistics and RCF Calculations, 1. Inflation direction indicates whether monthly inflation in April was higher or lower than monthly inflation in March. Deflation means prices fell in April compared to March.
Highlights:
- Food-at-home prices fell 0.2% in April, following a 0.3% decrease in March. Food-away-from home prices rose 0.4% but that was an improvement from the 0.6% increase in March.
- The price of new vehicles fell 0.2% in April and is up a relatively modest 5.4% vs. a year ago. However, used car and truck prices rose in April, reversing a downward trend. Even so, used car and truck prices are still down 6.6% from last year.
- Rent and owner equivalent rent continue to be main drivers of inflation with their prices rising faster in April than the overall CPI. This has been an ongoing issue. Excluding housing, year-over-year inflation in April was just 3.4%. However, April’s data do not suggest a big drop in housing inflation is at hand.
- Motor fuel prices rose 2.8% in April but are down 12.4% vs. a year ago. Public transportation (which includes airfares) fell 5.0% in April, a big turnaround from the 3.2% increase in March. It’s been a volatile category, but overall prices are little changed from a year ago.
- Earlier we noted that annualized inflation over the past six months (3.3%) has been much lower than during the prior six-month period (6.6%). Looking at the individual components, we find that 44% of the index had lower inflation over the past six months and 21% of the index had higher inflation. Housing inflation (one-third of the CPI) was the same during the past six months as it was in the prior six months.