Inflation worsens, putting Fed in difficult position
Peter Bernstein, Chief Economist pbernstein@rcfecon.com, 312-431-1540 x1515
Louise Collis, Senior Economist
September 11, 2025
The Current Situation
The CPI All Items rose 0.4% in August; year-on-year inflation increased to 2.9%, up from 2.7% in July. Core CPI, which does not include food and energy categories, increased 0.3% for the month and 3.1% for the year. Moreover, inflation has been worsening with the CPI up at a 3.5% annualized rate over the past three months.
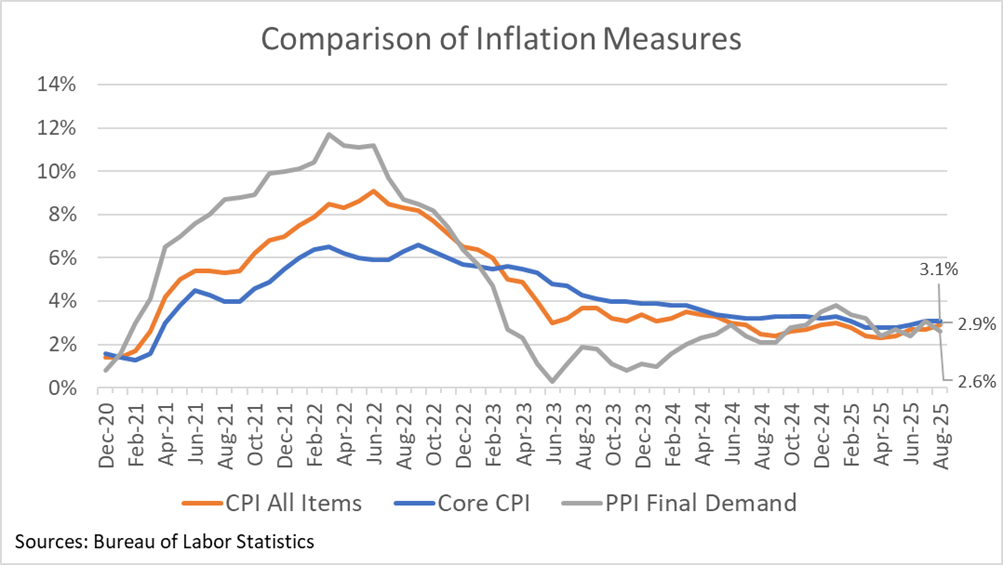
Economists have been looking for signs of the effects of tariffs on consumer prices. One source of information is the comparison of CPI – the prices consumers pay – and PPI – the prices that domestic producers receive. PPI does not include taxes (or tariffs) because these are not retained by the seller, but are passed on to the revenue collecting agency. CPI does reflect the impact of tariffs to the extent that businesses are passing the costs on to consumers. Over the same three months in which the CPI has increased at a 3.5% annualized rate, the PPI has risen just 2.5% annualized. It is reasonable that much of that difference reflects the added impact of tariffs on consumers.
Higher inflation along with the recent downward revisions to employment growth puts the Federal Reserve in a difficult position. The interest rate cuts designed to spur economic activity might also exacerbate inflation. Some Fed officials have argued that monetary policy should look past the tariff impact on inflation as it is likely to be temporary. However, consumers cannot “look past” higher prices that they face and the Fed’s track record for identifying transitory inflation has not been stellar. While we expect the Fed to cut rates in September, we also believe they will move cautiously after that unless they see evidence that inflation is not rising further.
RCF’s Inflation Scorecard
RCF’s Inflation Scorecard is based on analysis of 20 different price series comprising 98% of the total consumer price index. Each of these price series represents a portion of the CPI based on household spending patterns. For example, food purchased for at-home consumption is about 8% of the typical consumer’s budget; it has a weight of 8.04 out of a total index of 100.
RCF Inflation Scorecard: August 2025
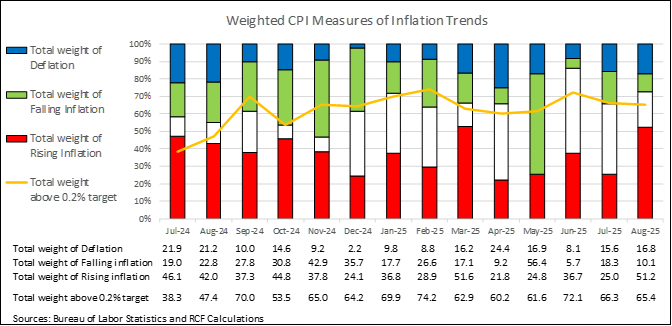
Our scorecard presents two metrics to track month-to-month price increases. The first metric is the share of the index for which inflation in the most recent month is rising (greater than the prior month’s inflation) vs. the share of the index for which inflation is falling (lower than the prior month) or prices fell (deflation). Our first metric shows that 10% of the weighted CPI had falling inflation in August vs July. Another 17% of the weighted CPI saw prices fall in August (deflation). Together, only 27% of the weighted CPI showed lower inflation or deflation in August. Over half (51%) of the weighted CPI showed rising inflation in August.
Our second metric shows that 65% of the weighted CPI still has monthly inflation above 0.2%, a monthly figure that corresponds to the Fed’s annual target of 2% inflation. That is slightly better than last month, but worse than one year ago. There has been very little progress on reducing inflation in the last year based on our second metric
Analysis of Individual Components of the Consumer Price Index
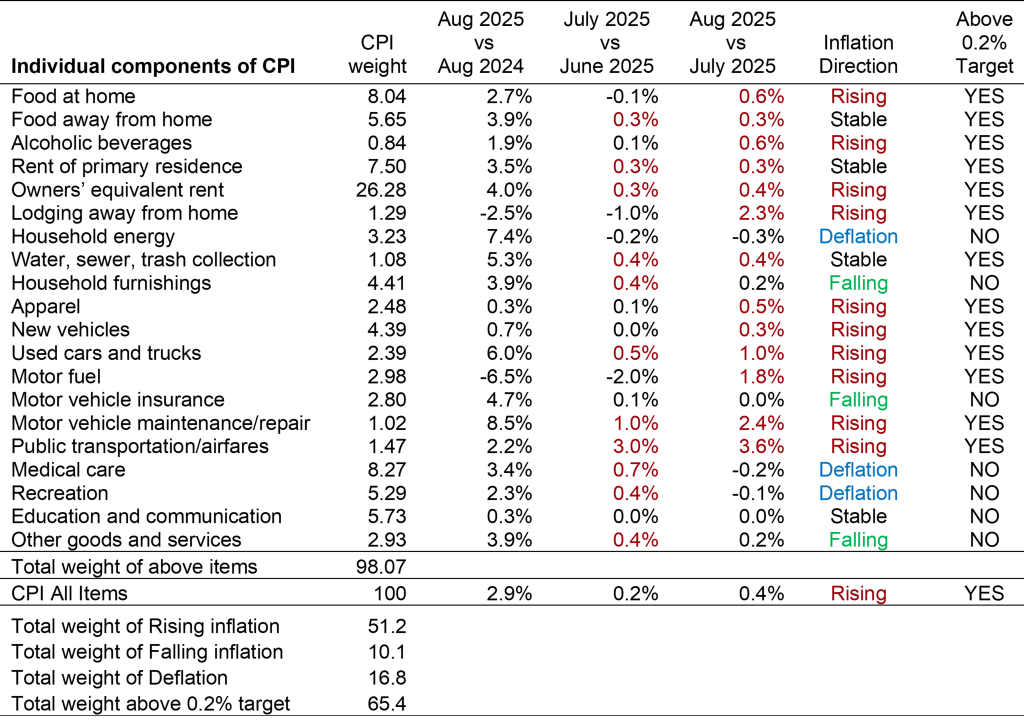
Sources: Bureau of Labor Statistics and RCF Calculations 1. Inflation direction indicates whether monthly inflation in August was higher or lower than monthly inflation in July. Deflation means prices fell in August vs July.
Highlights:
- Food at home prices rose 0.6% for the month, along with alcoholic beverages. Food away from home rose 0.3%. Meat is up 1.8% for the month, and beef in particular is up 14% for the year. Coffee continues to rise: up 3.6% in August and 21% year over year.
- Owners’ equivalent rent and rent of primary residence are up 0.4% and 0.3% respectively. The year-on-year rates (4% and 3.5%) are still well above the 2% target but coming down slowly.
- Motor fuel prices are volatile: down 2% in July and now up 2% in August.
- New vehicles rose 0.3% in August, while used cars and trucks are up 1% for the month and up 6% for the year.
- Public transportation is up 3.6% in August, after a similar rise in July.
- Three components showed price declines in August: household energy, which like other energy categories continues to be volatile, down 0.3% in August but up 7% from a year ago; medical care, down 0.2% in the first price fall in a year; and recreation, which includes audio and visual equipment (down 0.3%) and toys (down 0.8%).
- Apparel, where we expect to see tariff effects, rose 0.5% in August but is up only 0.3% from a year ago.
- Water, sewer, and trash collection repeated its 0.4% rise for a third month and is up 5.3% for the year.