A Year of Small Progress on Inflation
Peter Bernstein, Chief Economist pbernstein@rcfecon.com, 312-431-1540 x1515
Louise Collis, Senior Economist
January 13, 2026
The Current Situation
The CPI All Items rose 0.3% in December; year-on-year inflation remained at 2.7%. Core CPI, which does not include food and energy categories, increased 0.2% for the month and 2.6% for the year. The report this month was eagerly awaited after two months of partial data, but it showed little change from what we saw in November. A category that economists have been watching is commodities with volatile food and energy stripped out. This is a mix of cars, furniture, apparel, electrical goods – many items with imported parts, many of which are subject to tariffs – making up about 20% of a typical budget.
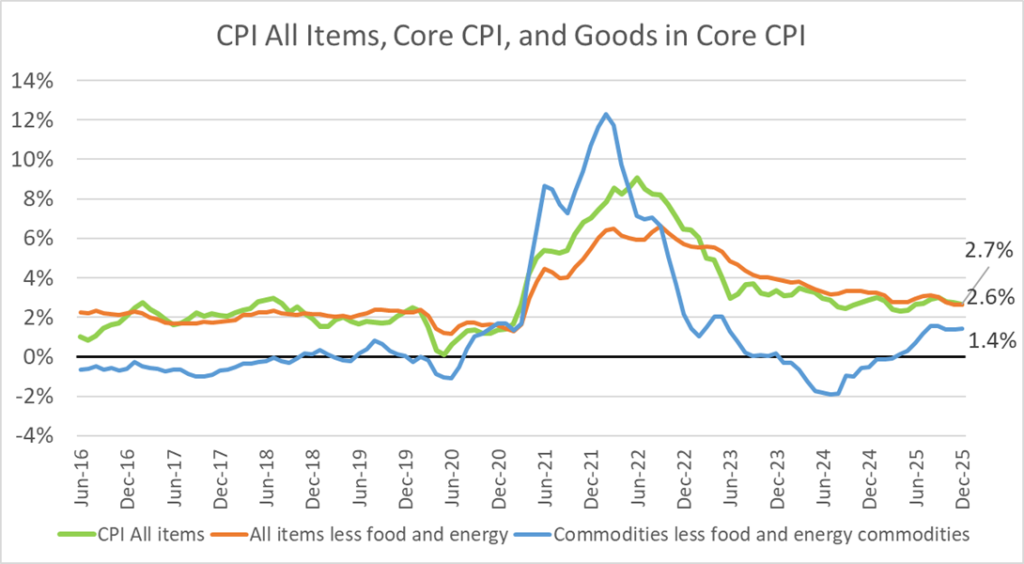
Historically these “core commodities” often have shown no inflation. They were heavily impacted by the pandemic supply-chain disruptions and shift from spending on services to goods but eventually shifted back to low inflation in early 2023 and then deflation in 2024. However, the period since April 2025 has seen a resurgence of core commodity inflation, likely due to tariffs.
In fact, if commodity inflation had remained near zero, overall inflation would be near the Fed’s 2 percent goal even with service price inflation running at its current 3% rate. Instead, the year ended with an inflation rate not much lower than the 2.9% rate in December 2024.
RCF’s Inflation Scorecard
RCF’s Inflation Scorecard is based on analysis of 20 different price series comprising 98% of the total consumer price index. Each of these price series represents a portion of the CPI based on household spending patterns. For example, food purchased for at-home consumption is about 8% of the typical consumer’s budget; it has a weight of 8.04 out of a total index of 100.
Our scorecard presents two metrics to track month-to-month price increases. The first metric is the share of the index for which inflation in the most recent month is rising (greater than the prior month’s inflation) vs. the share of the index for which inflation is falling (lower than the prior month) or prices fell (deflation). For November, in the absence of most October prices, we judged inflation to be rising if the price rise September to November converted to a monthly figure was greater than the change August to September. We revised our methodology since last month after reviewing the BLS FAQ about the 2025 federal government shutdown impact on the Consumer Price Index.
RCF Inflation Scorecard: December 2025
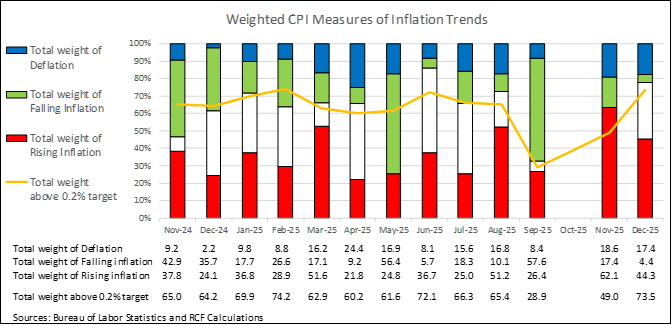
Our first metric shows that only 4% of the weighted CPI had falling inflation in December vs November. Another 17% of the weighted CPI saw prices fall in December (deflation). Together 22% of the weighted CPI showed lower inflation or deflation in November, our second-worst reading in the last 18 months. 44% of the weighted CPI showed rising inflation in November.
Our second metric shows that 74% of the weighted CPI still has monthly inflation above 0.2%, a monthly figure that corresponds to the Fed’s annual target of 2% inflation. This is the second highest in nearly two years, but some of the increase is a reflection of the low values in the September CPI report.
Analysis of Individual Components of the Consumer Price Index
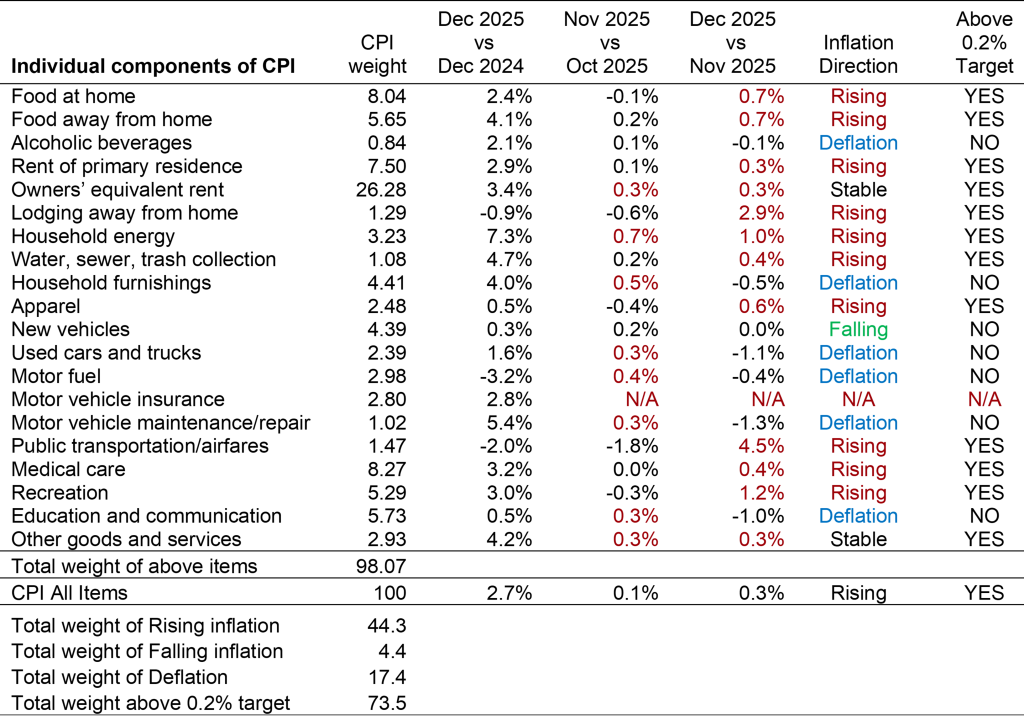
Sources: Bureau of Labor Statistics and RCF Calculations 1. Inflation direction indicates whether monthly inflation in December was higher or lower than monthly inflation in November. Deflation means prices fell in December vs November. Prices for Motor Vehicle Insurance were not reported for October or November. For products where no October price was published, October to November inflation is calculated as the monthly average inflation September to November.
Highlights:
- Food at home prices rose 0.7%, the largest increase since August 2022. Beef (up 1% for the month) and coffee (up1.9%) both have double-digit increases since a year ago, but >1% increases are across a broad range of foods including bread, cheese, ice cream, fresh fruit, and snacks. Food away from home also rose 0.7%, again the highest increase since 2022.
- Owners’ equivalent rent and rent of primary residence are both up 0.3%, returning to the average increase they have had over the last year. The published values in September and November were unusually low due to the carry-forward methodology, whereby prices that cannot be measured are assumed to stay the same.
- Motor fuel prices fell 0.4% and are down 3.2% from a year ago. Household energy is up 1.0%, and up 7.3% from a year ago.
- New vehicles were flat November to December, while used cars and trucks are down 1.1%. Motor vehicle insurance prices rose 2.8% for the year but were not reported for the previous two months.
- Public transportation/airfares, up 4.5%, and lodging away from home, up 2.9%, both showed large price increases following declines over the September to November period.
To see Peter discuss the latest CPI news on NewsNation, click here.