January shows Lower and Higher Inflation
Peter Bernstein, Chief Economist, pbernstein@rcfecon.com, 312-431-1540 x1515
The Current Situation
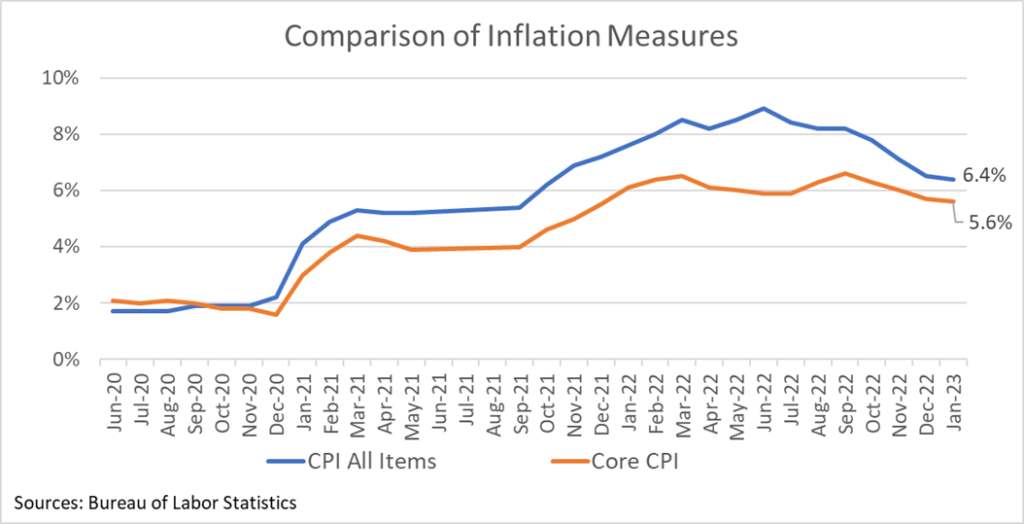
The January 2023 CPI was 6.4% higher than it was in January 2022, the lowest year-over-year reading since October 2021. But that good news was overshadowed by 0.5% month-to-month increase in prices, the highest monthly change since June 2022. Core CPI followed a similar pattern with year-over-year inflation dropping to 5.6%, its lowest level since late 2021, while the monthly price change was 0.4%, double the 0.2% monthly price increases that would produce annual inflation in the 2% range.
In short, inflation is declining but the pace of decline slowed last month. One factor is that motor fuel prices which had declined by nearly 25% in the last six months of 2022, increased 2.3% in January alone. Another factor was the continued increase in the BLS measure of rents and owner equivalent rent, which each rose 0.7% in January and are up about 8 percent vs. a year ago. We’ve discussed how the BLS housing cost measure doesn’t accurately reflect very recent trends in shelter prices. But even if one excludes shelter from the CPI calculation, inflation would have been 0.4% in January and 5.6% vs. a year ago.
The January data suggest that some of the low-hanging fruits of the inflation battle have been picked and that the path to the Fed’s 2% target may be slower and bumpier than we had hoped.
RCF’s Inflation Scorecard
RCF’s Inflation Scorecard is based on analysis of 20 different price series comprising 98% of the total consumer price index. Each of these price series represents a portion of the CPI based on household spending patterns. For example, food purchased for at-home consumption is about 8% of the typical consumer’s budget; it has a weight of 8.17 out of a total index of 100 as detailed later in this report.
Our scorecard presents two metrics to track month-to-month price increases. The first metric is the share of the index for which inflation in the most recent month is rising (greater than the prior month’s inflation) vs. the share of the index for which inflation is falling (lower than the prior month) or prices fell (deflation). Because deflation is showing up across more categories, we’ve added a separate measure of the total weight of deflation within the CPI index.
Our second metric is the share of the index for which the most recent month’s inflation exceeded 0.2%, a monthly rate that corresponds closely to the Federal Reserve’s target inflation rate of 2% per year.
RCF’s January Scorecard is a mix of good and bad news. The good news is that 58.2% of the weighted CPI index showed falling inflation or deflation (falling prices) in January. That’s a meaningful improvement over the 41% value of falling inflation or deflation in December.
But the bad news is that 80% of the weighted CPI had inflation above 0.2%. Thus, most of the components of the CPI have a pace of price increases above the Fed’s 2% target, the highest share for this metric since last August. One month of inflation data is not a trend but so far, 2023 is not off to a good start.
RCF Inflation Scorecard: January 2023

Analysis of Individual Components of the Consumer Price Index

Sources: Bureau of Labor Statistics and RCF Calculations 1. Inflation direction indicates whether monthly inflation in January was higher or lower than monthly inflation in December. Deflation means prices fell in January compared to December.
Highlights:
- Food prices have probably replaced gasoline prices as consumers’ biggest headache. The food at home price measure is up 11.3% vs. a year ago, and the food away from home measure is up 8.2%. At a finer level of detail, egg prices are up 70% year over year.
- Rent and owner’s equivalent rent inflation is still high with both up 0.7% in January. But that’s an improvement on the 0.8% increase in December. We expect to see rent inflation continue to trend down as softness in housing prices filters down to the apartment market.
- Vehicle price inflation is dropping with used cars and truck prices down 1.9% in January and down 11.6% compared to January 2022.
- While gasoline prices get a lot of attention, household energy represents almost as large a portion of the typical consumer’s budget. And whereas motor fuel prices are up just 1.9% year-over-year, household energy prices are up 15.8%.
- In a twist from historical trends, medical care is helping to keep a lid on inflation. Medical care prices fell 0.4% in January and are up just 3.1% compared to a year ago.