Tariffs are compounding the issue of inflation expectations
Peter Bernstein, Chief Economist pbernstein@rcfecon.com, 312-431-1540 x1515
Louise Collis, Senior Economist
August 12, 2025
The Current Situation
The CPI All Items rose 0.2% in July; year-on-year inflation was unchanged at 2.7%. Core CPI, which strips out the volatile food and energy categories, increased 0.3% for the month and 3.1% for the year. Inflation has hardly changed since July of last year when inflation for All Items was 2.9% and inflation for Core CPI was 3.2%.
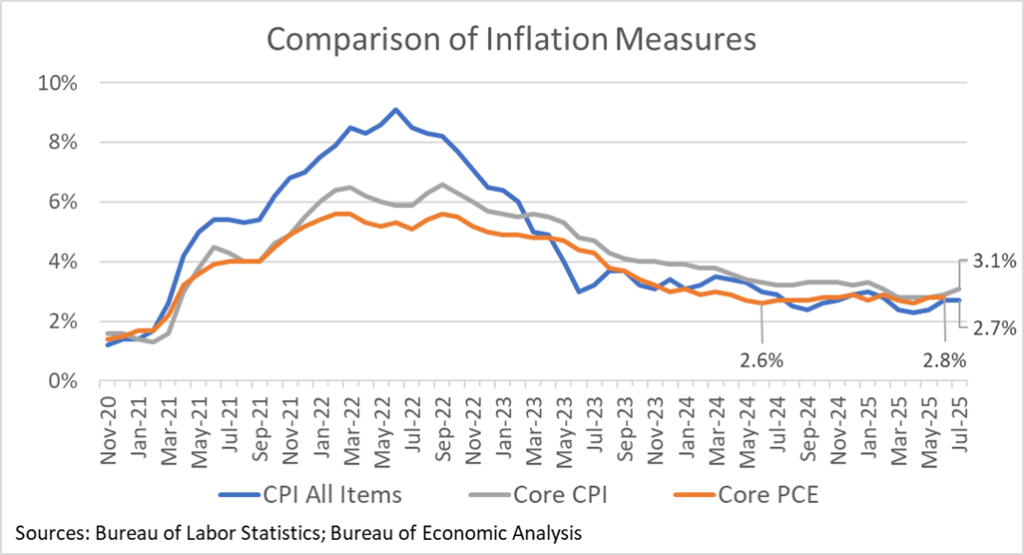
Importantly, the Federal Reserve’s preferred measure of inflation – the Personal Consumption Expenditures Core deflator, is higher than a year ago. While tariffs might be driving some of the increases, many components of the CPI which we don’t expect to be affected by tariffs continue to exceed target inflation. If businesses conclude that the government is not serious about bringing inflation down to 2%, expectations of this higher level of inflation will be built into prices and contracts and become even harder to reduce. And that may be happening. The most recent University of Michigan survey of consumers showed a median expected price increase over the next year of 5%; a year ago, the expectation was 3% which proved to be quite accurate.
RCF’s Inflation Scorecard
RCF’s Inflation Scorecard is based on analysis of 20 different price series comprising 98% of the total consumer price index. Each of these price series represents a portion of the CPI based on household spending patterns. For example, food purchased for at-home consumption is about 8% of the typical consumer’s budget; it has a weight of 8.04 out of a total index of 100.
Our scorecard presents two metrics to track month-to-month price increases. The first metric is the share of the index for which inflation in the most recent month is rising (greater than the prior month’s inflation) vs. the share of the index for which inflation is falling (lower than the prior month) or prices fell (deflation). Our first metric shows that 18% of the weighted CPI had falling inflation in July vs June. Another 16% of the weighted CPI saw prices fall in July (deflation). Together 34% of the weighted CPI showed lower inflation or deflation in July, a marked improvement from the 14% share in June.
RCF Inflation Scorecard: July 2025
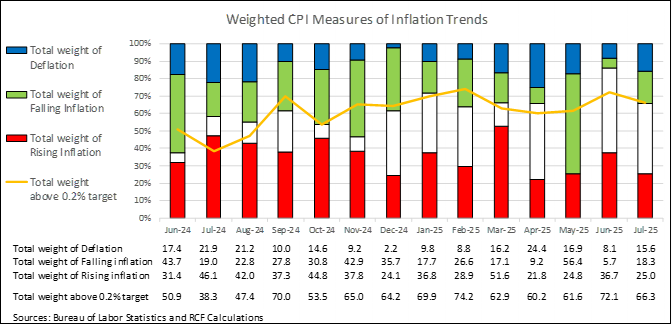
Our second metric shows that 66% of the weighted CPI still has monthly inflation above 0.2%, a monthly figure that corresponds to the Fed’s annual target of 2% inflation. That is better than last month, but the share is showing no overall downward trend with about two-thirds of the CPI consistently showing above target price increases.
Overall, our two metrics suggest a one-step forward, one-step back progress on inflation.
Analysis of Individual Components of the Consumer Price Index
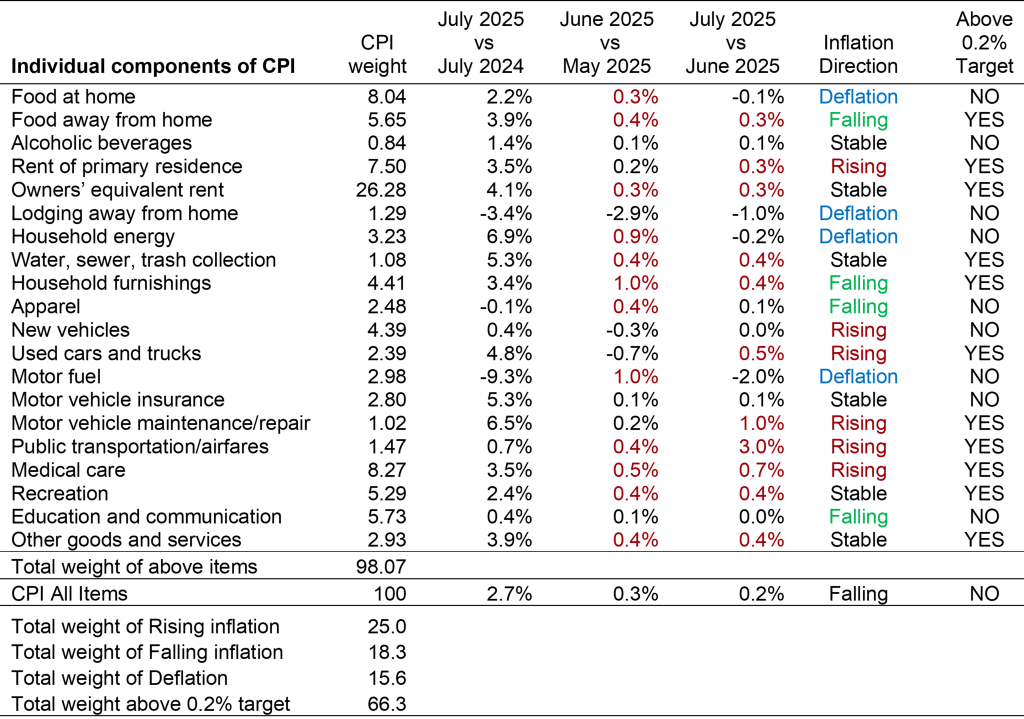
Sources: Bureau of Labor Statistics and RCF Calculations 1. Inflation direction indicates whether monthly inflation in July was higher or lower than monthly inflation in June. Deflation means prices fell in July vs June.
Highlights:
- Food away from home prices rose 0.3% for the month, but food at home fell 0.1%. Egg prices fell but are still 16.4% higher than a year ago. Coffee is up 2.3% in July and 14.5% year over year.
- Owners’ equivalent rent and rent of primary residence are both up 0.3%, which is stubbornly above target. Taken together, housing prices are up 3.9% for the year.
- Motor fuel prices fell 2% in July and are down 9% over the past year.
- In addition to food at home and motor fuel, two other components showed price declines in July: lodging away from home, which has fallen for the last five months and is down 3.4% from a year ago, and household energy, a volatile category which was down 0.2% in July but up 6.9% from a year ago.
- Two categories likely to be affected by tariffs moved in different directions in July. Household furnishing was up 0.4% following a 1.0% increase in June. But apparel prices rose only 0.1% in July and are down slightly from a year ago.
- Water, sewer, and trash collection, which might be expected to feel little effect from tariffs, rose 0.4% in July after rising 0.4% in June.
- Public transportation is up 3% in July, driven mainly by airfares which rose 4%.
- Recreation, which is up 0.4% for the month, includes tariff-vulnerable components such as televisions, audio equipment, and photographic equipment, up 0.5%, 2.2%, and 2.1% respectively in July.