
Iran Conflict Inflation Subsiding, Focus Now on Core Price
Peter Bernstein, Chief Economist pbernstein@rcfecon.com, 312-431-1540 x1515
Louise Collis, Senior Economist
August 12, 2026
The Current Situation
The CPI All Items rose 0.1% in July, following a 0.4% decline in June as the price surge following the U.S. conflict with Iran has subsided. Year-on-year inflation fell to 3.4% after hitting a recent peak of 4.2% in May. Given the volatility in fuel and energy prices, it is best to look at core prices to see a clearer picture of the inflation outlook. In July, core CPI (excluding food and energy) rose 0.2%, which led to an annual core inflation rate of 2.5%, about where it was six months ago. Stable core inflation is good news, suggesting that the high energy prices are not bleeding into the general economy. That said, 2.5% inflation is still above the Fed’s 2% target.
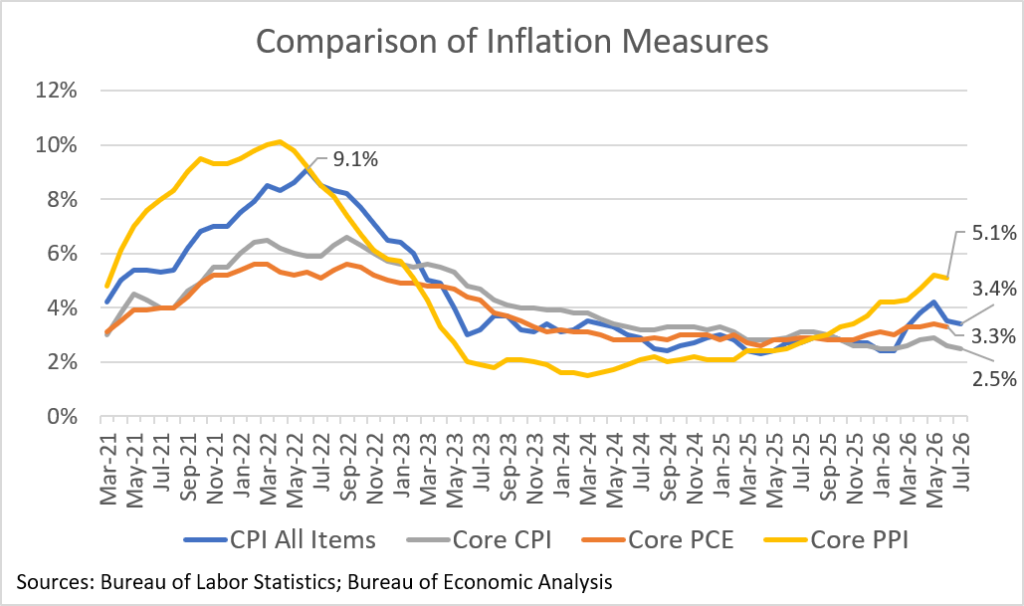
July values for two other inflation measures, core PCE and core PPI, are not yet available, but the June numbers were not promising with June core PCE showing 3.3% inflation and June core PPI showing inflation of 5.1%.
Despite elevated inflation, consumers keep spending – up 6.3% in June year-over-year. With incomes rising only about 4% this increase in spending has come at the expense of a decline in savings. The savings rate fell to 2.7% of disposable increase in June, down from 4.5% at the start of the year, and well below the 5.5% rate in 2024 and 2025. Unless price pressures dramatically ease or household incomes suddenly rise, the mismatch of spending and income will eventually lead to a slowdown in economic activity.
RCF’s Inflation Scorecard
RCF’s Inflation Scorecard is based on analysis of 20 different price series comprising 98% of the total consumer price index. Each of these price series represents a portion of the CPI based on household spending patterns. For example, food purchased for at-home consumption is about 8% of the typical consumer’s budget; it has a weight of 8.33 out of a total index of 100.
Our scorecard presents two metrics to track month-to-month price increases. The first metric is the share of the index for which inflation in the most recent month is rising (greater than the prior month’s inflation) vs. the share of the index for which inflation is falling (lower than the prior month) or prices fell (deflation).
Our first metric shows that 15% of the weighted CPI saw deflation, with prices lower in July than in June. That is about average for the last three years. Another 10% of the weighted CPI had lower inflation in July than June. A whopping 70% of the weighted CPI had rising inflation, meaning that the July price increase was higher than the June price increase. While that is the worst since inflation was at its peak in June 2022, it is driven mostly by comparison with June when prices actually fell.
RCF Inflation Scorecard: July 2026
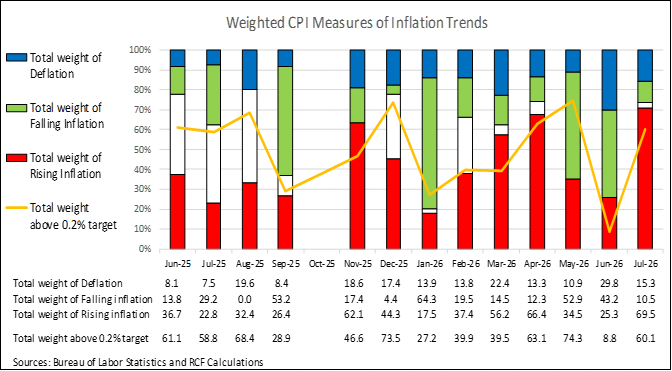
Our second metric is the share of the weighted CPI that had monthly inflation above 0.2%, a level that corresponds to the Fed’s 2% annual target. For the current month, it is a better measure of inflationary trends. 60% of the weighted CPI had inflation above target. That’s a bit higher than average over the last three years, but far from the record of 90%, again in June 2022.
Recent improvements in the inflation numbers will take some pressure off the Fed to hike rates. Even so, the underlying data cause us to expect little near-term improvement in the cost-of-living struggles facing many Americans.
Analysis of Individual Components of the Consumer Price Index
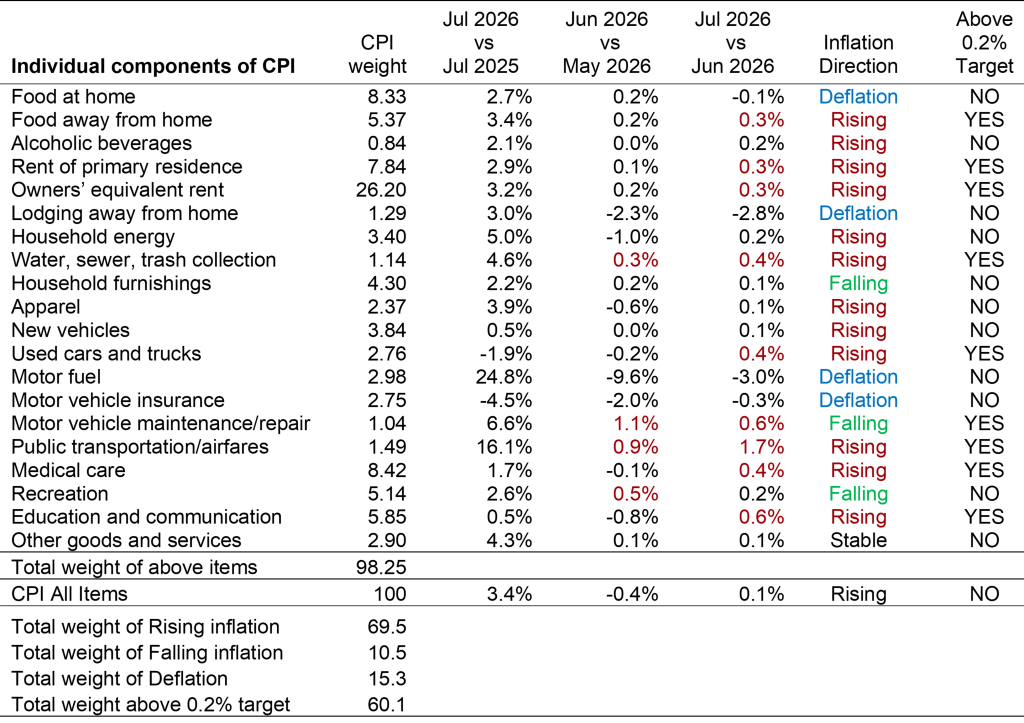
Sources: Bureau of Labor Statistics and RCF Calculations 1. Inflation direction indicates whether monthly inflation in July was higher or lower than monthly inflation in June. Deflation means prices fell in July vs June.
Highlights:
- Motor fuel prices dropped 3% for the month, following a drop of 10% last month. It’s still up 25% for the year. Reflecting higher fuel costs, public transportation/airfares are up 16% from a year ago.
- Household energy prices are up 0.2% for the month, and up 5% for the year. Electricity is up 0.1% in July, and utility gas is up 0.7%. Household fuel oil is down 1.7% for the month on a seasonally adjusted basis, but up 1% for the month unadjusted, and up 39% for the year.
- Food at home is down 0.1% for the month and up 2.7% for the year. Food away from home is up 0.3% in July, and up 3.4% for the year.
- Rent and owner’s equivalent rent are both up 0.3% in July. Year over year, they are up 2.9% and 3.2%, respectively. A separate measure by Zillow estimates that rents are up 2.2% from a year ago.
- New vehicles are up 0.1% for the month and up 0.5% for the year. Used cars and trucks are up 0.4%, but motor vehicle insurance prices are down 0.3% for the month. Both are down for the year: 1.9% and 4.5% respectively. Vehicle insurance prices are now back down to August 2024 levels, but up 50% from the start of 2022.
- Lodging away from home is down 2.8% for the month, and both medical care and education and communication prices are below target for the year, at 1.7% and 0.5% respectively.
