
Some relief, but mainly a partial reversal of recent increases
Peter Bernstein, Chief Economist pbernstein@rcfecon.com, 312-431-1540 x1515
Louise Collis, Senior Economist
July 14, 2026
The Current Situation
The CPI All Items fell 0.4% in June, partially reversing the very high readings of 0.9%, 0.6% and 0.5% of the previous three months. Year-on-year inflation fell to 3.5% – still well above target. The biggest source of relief was from energy prices, which fell 5.7%, but several other categories saw price decreases, too. Core CPI prices were flat in June causing the annual core inflation rate to fall to 2.6%. The decline in core inflation is probably the bigger story as it indicates that recent energy price increases have had a fairly limited impact on prices in other sectors. In the four months since the Gulf conflict began in February, annualized core inflation was just 2.3%, less than half the annualized 4.8% rate for all prices.
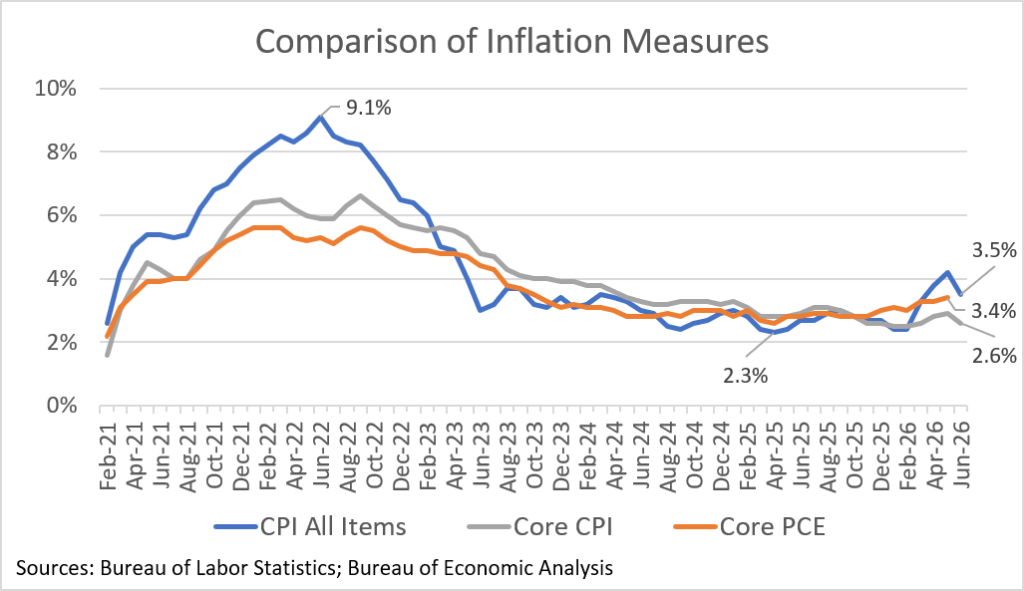
The key question now is whether June will prove to be the start of a disinflationary trend or a transitory blip. With hostilities again heating up with Iran, and oil prices rising so far in July, fuel prices appear likely to jump again, reversing June’s decline. New Fed Chair Kevin Warsh, who no doubt welcomed the favorable June report, nonetheless pointed out that it is just one piece of data. Other Fed members have said they need to see more evidence of declining inflation before they can rule out interest rate increases later in the year. For consumers, battered after several years of above normal inflation, even a one-month reprieve is something to cheer.
RCF’s Inflation Scorecard
RCF’s Inflation Scorecard is based on analysis of 20 different price series comprising 98% of the total consumer price index. Each of these price series represents a portion of the CPI based on household spending patterns. For example, food purchased for at-home consumption is about 8% of the typical consumer’s budget; it has a weight of 8.33 out of a total index of 100.
Our scorecard presents two metrics to track month-to-month price increases. The first metric is the share of the index for which inflation in the most recent month is rising (greater than the prior month’s inflation) vs. the share of the index for which inflation is falling (lower than the prior month) or prices fell (deflation).
Our first metric shows that 30% of the weighted CPI saw deflation, with prices lower in June than in May. That is the highest share of falling monthly prices since we began keeping our Scorecard. Another 43% of the weighted CPI had lower inflation in June than May. Most of that 43% came from smaller increases in the shelter prices. Only about one-quarter of the weighted CPI had rising inflation, meaning that the June price increase was higher than the May price increase. That’s the best reading since January.
RCF Inflation Scorecard: June 2026
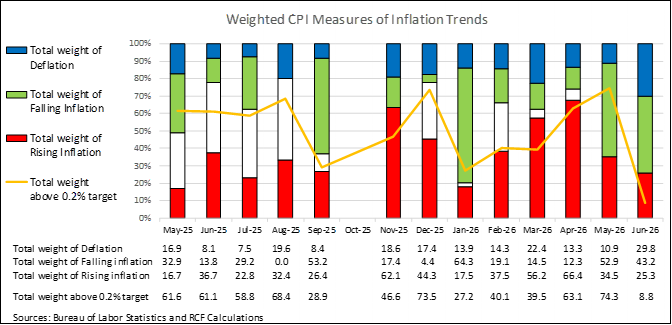
Our second metric is the share of the weighed CPI that had monthly inflation above 0.2%, a level that corresponds to the Fed’s 2% annual target. The high number of categories with deflation, together with cool readings on shelter, lead to the lowest number since we began our Scorecard. Only four of the categories we track, representing about 9% of the weighted CPI, had month-to-month inflation above 0.2%: water and sewer and trash collection services, motor vehicle maintenance and repair, public transportation, and recreation.
On the surface, our June metrics are the best we have seen since inflation began rising in 2021. The caveat here is that most of the improvement in June was because the May data were so bad. In fact, while 91% of the weighted CPI had June inflation of 0.2% or lower, only 23% had low inflation in both May and June.
Analysis of Individual Components of the Consumer Price Index
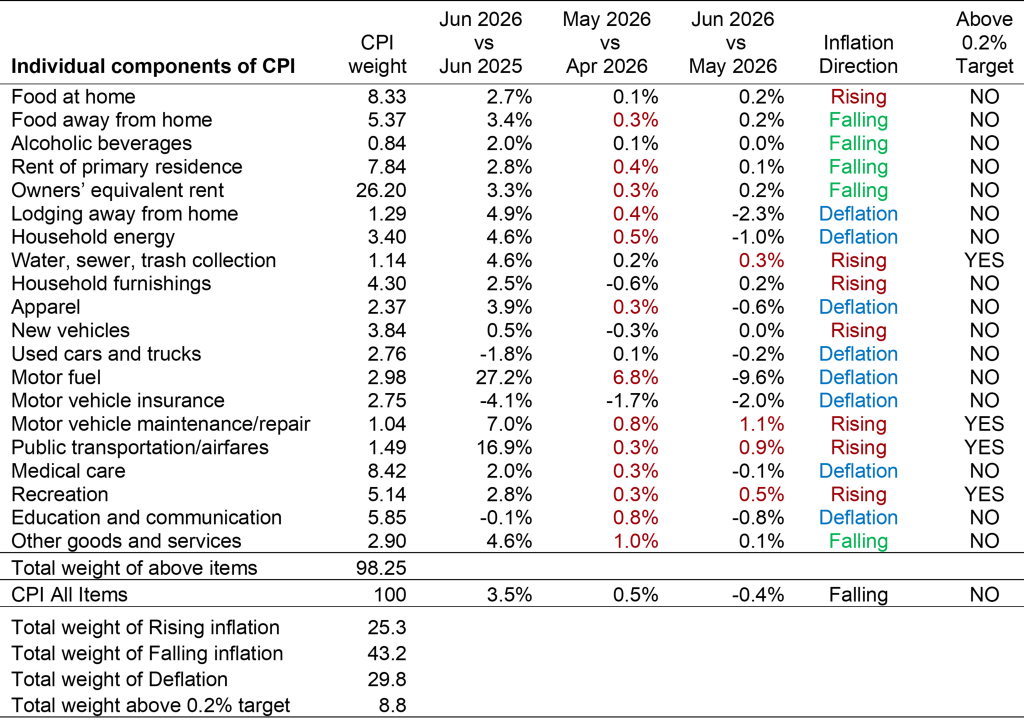
Sources: Bureau of Labor Statistics and RCF Calculations 1. Inflation direction indicates whether monthly inflation in June was higher or lower than monthly inflation in May. Deflation means prices fell in June vs May.
Highlights:
- Motor fuel prices dropped 10% for the month, which partially reverses the 37% increase of the previous three months. Gasoline prices are similarly down 10% for the month, but up 27% for the year.
- Food at home and food away from home prices both rose 0.2% in June. Compared to a year ago, food at home prices are up 2.7% and food away from home prices are up 3.4%.
- The big contributors to lower core inflation are rent, up just 0.1% in June, and owner’s equivalent rent, up 0.2% in June. Year over year, they are up 2.8% and 3.3%, respectively.
- Household energy prices are down 1.0% for the month, but up 1.0% on an unadjusted basis as they usually rise in early summer, so that decrease is a bit of a statistical quirk.
- Several other categories fell in price this month:lodging away from home is down 2.3%, apparel is down 0.6%, medical care is down 0.1% and education and communication prices are down 0.8%.
- Used cars and trucks are down 0.2% and motor vehicle insurance prices are down 2% for the month. Both are down for the year: 2% and 4% respectively. The decline in vehicle insurance follows a long period in which prices were increasing at double-digit rates. New vehicles are flat for the month and up 0.5% for the year.
- Not all the news was good in June. Public transportation/airfares are up 17% from a year ago and rose 0.9% for the month.
