Oil Price Increase Pass-Through may be Slow but Long-Lasting if High Prices Continue
Louise Collis, Senior Economist
Peter Bernstein, Chief Economist pbernstein@rcfecon.com, 312-431-1540 x1515
April 10, 2026
The Current Situation
The CPI All Items rose 0.9% in March – the highest jump since June 2022. Year-on-year inflation rose to 3.3 % – the highest in nearly two years. Core CPI, which does not include food and energy categories, was stable at 0.2% for the month and was 2.6% for the year, slightly higher than last month. Unsurprisingly, most of the increase was driven by higher fuel prices, with fuel oil up 44% on the year before.
The big question is whether oil prices will remain high for long enough to feed into broader inflation. Because oil is used in everything from plastics and fertilizers to transportation and factory power, its price affects a wide array of goods and services. If the price increase is short-lived, firms may absorb the cost, but if higher prices persist, they will eventually show up in Core CPI. In the figure below, Core CPI did not rise as quickly or as high as CPI All Items in 2021 and 2022. But it has also taken much longer to come down, averaging 0.3 percentage points higher than CPI All Items over the last two years.
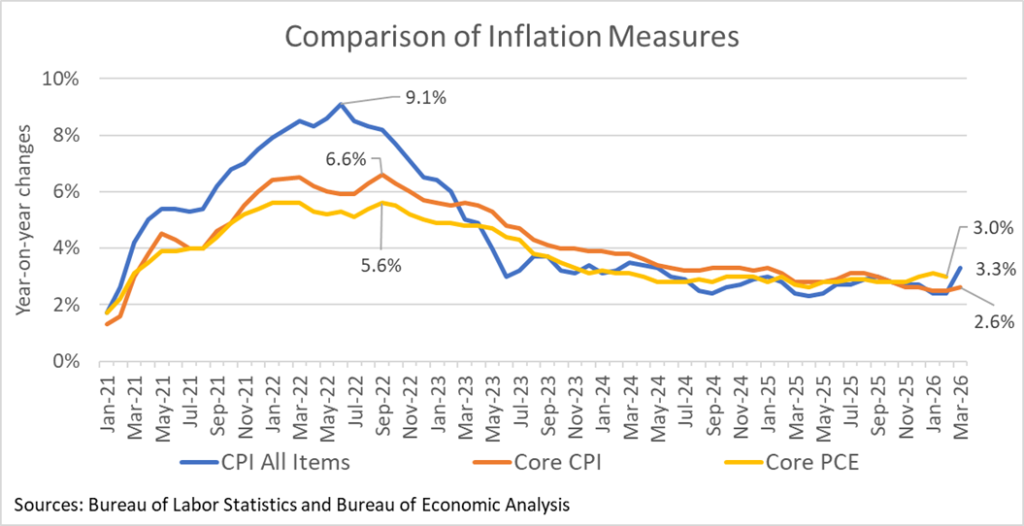
When considering interest rate changes, the Fed uses Core PCE – Personal Consumption Expenditures excluding food and energy – as published by the Bureau of Economic Analysis. The February Core PCE published yesterday showed a rate of 3%, which is a full percentage point above target, and that was before the recent oil price rises. A 2023 Fed Note[1] found that an increase in oil prices had measurable pass-through to core prices, with effects building over many quarters. Unless oil prices come down quickly, we may see those increases showing up in the Core PCE and they may be stubborn to bring down.
RCF’s Inflation Scorecard
RCF’s Inflation Scorecard is based on analysis of 20 different price series comprising 98% of the total consumer price index. Each of these price series represents a portion of the CPI based on household spending patterns. For example, food purchased for at-home consumption is about 8% of the typical consumer’s budget; it has a weight of 8.04 out of a total index of 100.
Our scorecard presents two metrics to track month-to-month price increases. The first metric is the share of the index for which inflation in the most recent month is rising (greater than the prior month’s inflation) vs. the share of the index for which inflation is falling (lower than the prior month) or prices fell (deflation). For November, in the absence of most October prices, we judged inflation to be rising if the price rise September to November converted to a monthly figure was greater than the change August to September.
RCF Inflation Scorecard: March 2026
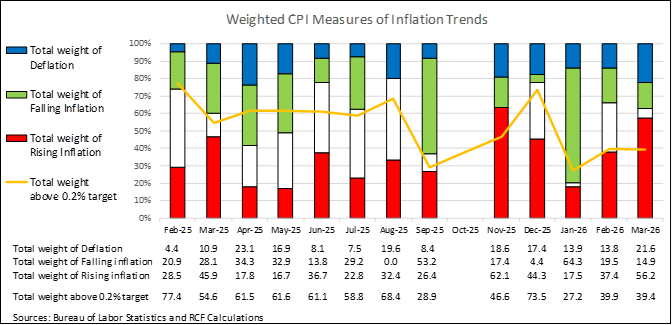
Our first metric shows that 15% of the weighted CPI had falling inflation in March vs February. Another 22% of the weighted CPI saw prices fall in March (deflation). Together 37% of the weighted CPI showed lower inflation or deflation in March. Fifty-six percent (56%) of the weighted CPI showed rising inflation in March, which is the second-highest in two years.
Our second metric shows that 40% of the weighted CPI has monthly inflation above 0.2%, a monthly figure that corresponds to the Fed’s annual target of 2% inflation. This is the fourth lowest share since we began tracking. Taken together, our two metrics show that while oil prices are showing up in higher average inflation, they have not yet spread to most categories.
Analysis of Individual Components of the Consumer Price Index
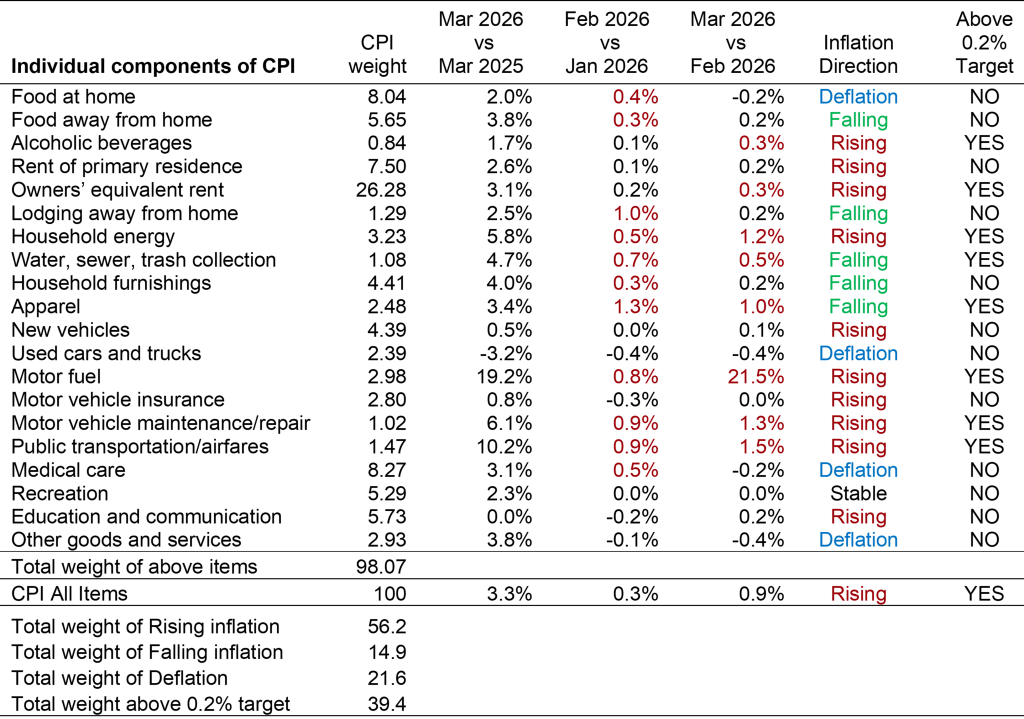
Sources: Bureau of Labor Statistics and RCF Calculations 1. Inflation direction indicates whether monthly inflation in March was higher or lower than monthly inflation in February. Deflation means prices fell in March vs February.
Highlights:
- Motor fuel prices rose 22% for the month and are up 19% from a year ago. Household energy is up 1.2% for the month, and up 6% from a year ago. Energy accounts for about 6.5% of the typical consumer budget and is up 10.9% for the month.
- Public transportation/airfares are up 1.5% in March and up 10% for the year. Airline fares are up 2.7% for the month, and other intercity transportation is up 3.5% in March.
- Food at home prices fell 0.2%, although fruits and vegetables are up 1% for the month. Meat is down 0.6% for the month but is up 7% for the year. Food away from home rose 0.2%.
- Owners’ equivalent rent and rent of primary residence are up 0.3% and 0.2% in March, returning to long-term averages after an unusually low value last month. Lodging away from home is up 0.2% since February and up 2.5% for the year.
- Water, sewer, trash collection is up 0.5% for the month and 5% for the year. Household furnishings prices are up 4% year on year.
- Medical Care is down 0.2% for the month.
- New vehicle prices are up 0.1%, while used cars and trucks are down 0.4% for the second month, and are down 3.2% from a year ago. Motor vehicle insurance prices are flat, but Motor vehicle maintenance/repair is up 1.3% for the month.
[1] Alp, Harun, Matthew Klepacz, and Akhil Saxena (2023). “Second-Round Effects of Oil Prices on Inflation in the Advanced Foreign Economies,” FEDS Notes. Washington: Board of Governors of the Federal Reserve System, December 15, 2023, https://doi.org/10.17016/2380-7172.3401.