Not a transitory spike, with inflation showing up across sectors and more to come
Peter Bernstein, Chief Economist pbernstein@rcfecon.com, 312-431-1540 x1515
Louise Collis, Senior Economist
June 11, 2026
The Current Situation
The CPI All Items rose 0.5% in May, resulting in an increase in just the last three months of 2%. That’s what we would usually expect in a year. Year-on-year inflation rose to 4.2%. Energy price increases continue to accelerate, with motor fuel rising faster in May than it did in April.
And there are reasons to think that inflation is likely to move higher. The May Producer Price Index (PPI) was released today, up 6.5% from a year ago, the highest producer inflation rate since 2022. Higher producer prices usually lead to higher consumer prices down the road. For example, in 2021, PPI began rising earlier and faster than CPI. Moreover, the full impact of higher prices for fuel and fertilizer have not fully taken effect yet because many agricultural products are sold under contracts made months previously, and so it takes time for increases to hit consumers.
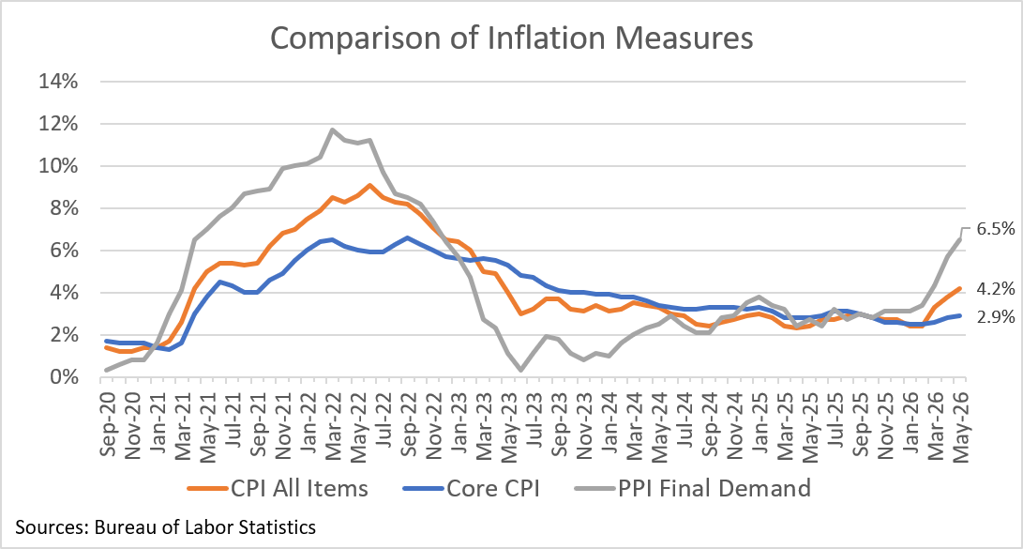
Searching for a silver lining, we note that Core CPI rose only 0.2% in May and is up a more modest 2.9% year on year. Even so, core inflation is rising after hitting a multi-year low of 2.5% in February.
But it is overall CPI that determines the cost of living. We mentioned last month that wages were not keeping up with prices and the May data have worsened this trend with real wages having now fallen 0.8% from a year ago. With wage growth trending down and inflation trending up, the affordability problem is likely to get worse before it gets better.
RCF’s Inflation Scorecard
RCF’s Inflation Scorecard is based on analysis of 20 different price series comprising 98% of the total consumer price index. Each of these price series represents a portion of the CPI based on household spending patterns. For example, food purchased for at-home consumption is about 8% of the typical consumer’s budget; it has a weight of 8.33 out of a total index of 100.
Our scorecard presents two metrics to track month-to-month price increases. The first metric is the share of the index for which inflation in the most recent month is rising (greater than the prior month’s inflation) vs. the share of the index for which inflation is falling (lower than the prior month) or prices fell (deflation).
Our first metric shows that 35% of the weighted CPI has rising inflation meaning that the May price increase was even higher than the April price increase. That’s better than the last three months, but it’s still worse than average over the past three years. 53% of the weighted CPI had falling inflation in May vs April, largely made up of shelter. Another 11% of the weighted CPI saw prices fall in May (deflation).
RCF Inflation Scorecard: May 2026
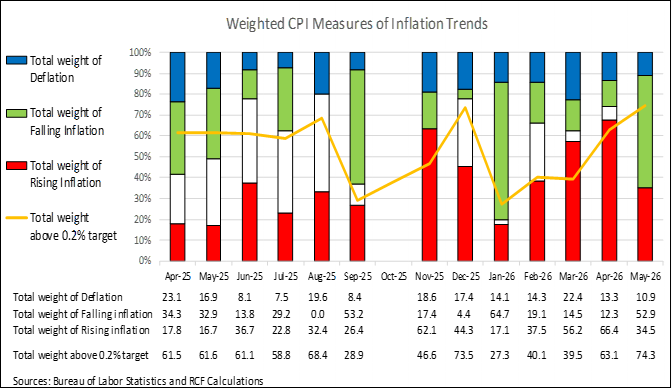
Our second metric is the share of the weighed CPI that had monthly inflation above 0.2%, a level that corresponds to the Fed’s 2% annual target. And it is this metric for which the data from May are a concern. Nearly three-quarters of the weighted CPI had monthly inflation above 0.2%, the highest share in over a year. We note that in January, just 27% of the weighted CPI had monthly inflation above 0.2%. It’s therefore not just fuel and energy prices that have moved from below target monthly inflation to above target inflation. What we hoped would be a transitory shock is starting to become widespread and will be that much harder to turn around.
New Fed Chair Kevin Warsh was presumably hoping to convince the other Fed members to vote for interest rate cuts. With inflation now about 4% he will have trouble convincing them to resist raising rates instead.
Analysis of Individual Components of the Consumer Price Index
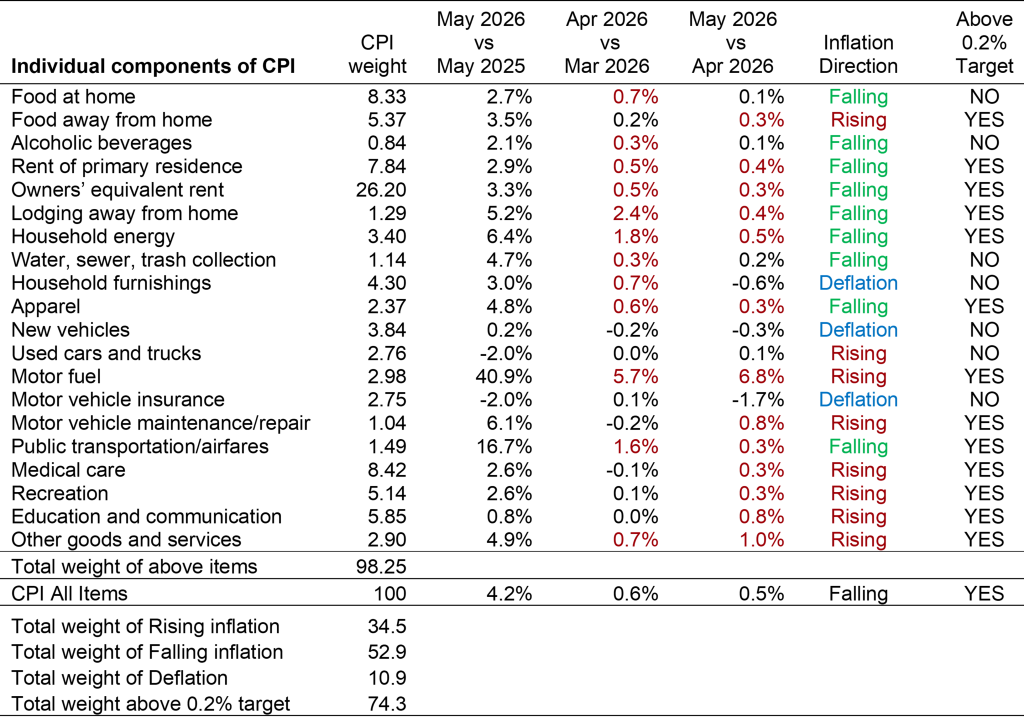
Sources: Bureau of Labor Statistics and RCF Calculations 1. Inflation direction indicates whether monthly inflation in May was higher or lower than monthly inflation in April. Deflation means prices fell in May vs April.
Highlights:
- Motor fuel prices rose 7% for the month and are up 41% from a year ago. Gasoline prices which are an element of motor fuel are up 40% for the year and jumped 9% for the month on a non-seasonally adjusted basis. Seasonally adjusted, the monthly increase is only 7% since prices usually increase in May, but that is little comfort to drivers.
- Higher fuel prices aren’t just hitting drivers. Public transportation/airfares are up 16.7% from a year ago. The airfare portion is up a whopping 27% from May 2025 reflecting airlines’ higher cost for fuel.
- Household energy is up 0.5% for the month after being up 1.8% in April.
- Food at home prices rose 0.1%, a substantial drop from the 0.7% increase in April. Meat is down 1.1% for month but is up 8% for the year. Food away from home rose 0.3% in May.
- For a long time, shelter prices have been rising faster than prices in general. That is no longer true. Rent in May is 2.9% vs. a year ago. Owner’s equivalent rent – a big portion of the CPI – is up 3.3%, so both of these shelter price measures are below the 4.2% increase in overall prices. The bad news is CPI excluding shelter is up 4.6% from a year ago. In May 2025, that figure was just 1.5%.
- There’s some good news that partially offsets the increase in gas prices. New vehicle prices are down 0.3%, while used cars and trucks are up 0.1% for the month, but down 2.0% from a year ago. Motor vehicle insurance prices are down 1.7% in May.