
Inflation Jumps in September, Core Readings Raise Further Concerns
Peter Bernstein, Chief Economist pbernstein@rcfecon.com, 312-431-1540 x1515
Louise Collis, Senior Economist
October 15, 2026
The Current Situation
The CPI All Items rose 0.6% in September, following a 0.4% rise in August. Year-on-year inflation rose to 3.7%. Core inflation (which excludes food and energy) rose 0.3% in September and 2.6% from a year ago. Though core inflation remains lower than the headline number, the near-term trend is concerning. Over the past three months, core prices have risen at a 3.4% annual rate. Adding to the problem is the even larger increase in wholesale prices. The producer price index (PPI) jumped 1.3% in September and is up 6.3% from a year ago. That points to further price increases at the consumer level in the coming months.
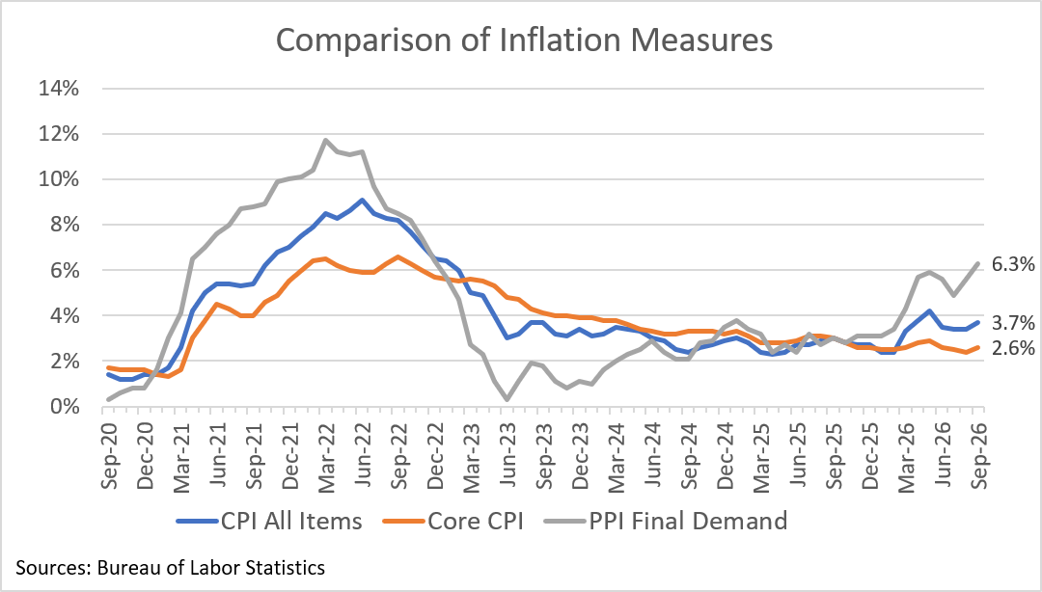
Inflation is increasing even as workers’ wage growth has decelerated. In November 2025, year-over-year wage growth was 3.9%, well above the 2.7% year-over-year increase in consumer prices. By September 2026, wage growth had weakened to 3% while inflation rose to 3.7%. The September CPI report puts added pressure on the Fed to reduce inflation, suggesting that increases in the fed funds rate are almost certain before the end of the year.
RCF’s Inflation Scorecard
RCF’s Inflation Scorecard is based on analysis of 20 different price series comprising 98% of the total consumer price index. Each of these price series represents a portion of the CPI based on household spending patterns. For example, food purchased for at-home consumption is about 8% of the typical consumer’s budget; it has a weight of 8.33 out of a total index of 100.
Our scorecard presents two metrics to track month-to-month price increases. The first metric is the share of the index for which inflation in the most recent month is rising (greater than the prior month’s inflation) vs. the share of the index for which inflation is falling (lower than the prior month) or prices fell (deflation).
RCF Inflation Scorecard: September 2026
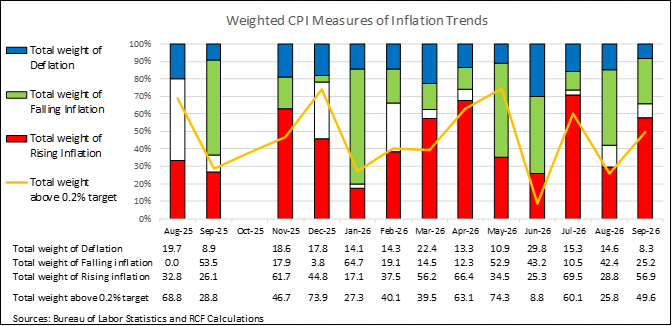
Our scoreboard shows that the numbers have been tictacking between good and bad months for the last five months and reinforces the warning to not over-react to one good or bad month. That said, September was a bad month with 57% of the weighted CPI showing rising monthly inflation vs August. Only 8% of the weighted CPI saw deflation, the lowest share of falling prices in over a year. Another 25% had lower monthly price increase in September than August.
Our second metric is the share of the weighed CPI that had monthly inflation above 0.2%, a level that corresponds to the Fed’s 2% annual target. 50% of the weighted CPI had inflation above target and 50% below target. The problem, however, is that half of the CPI with above target inflation is well above target, while those that are below target are barely below.
Analysis of Individual Components of the Consumer Price Index
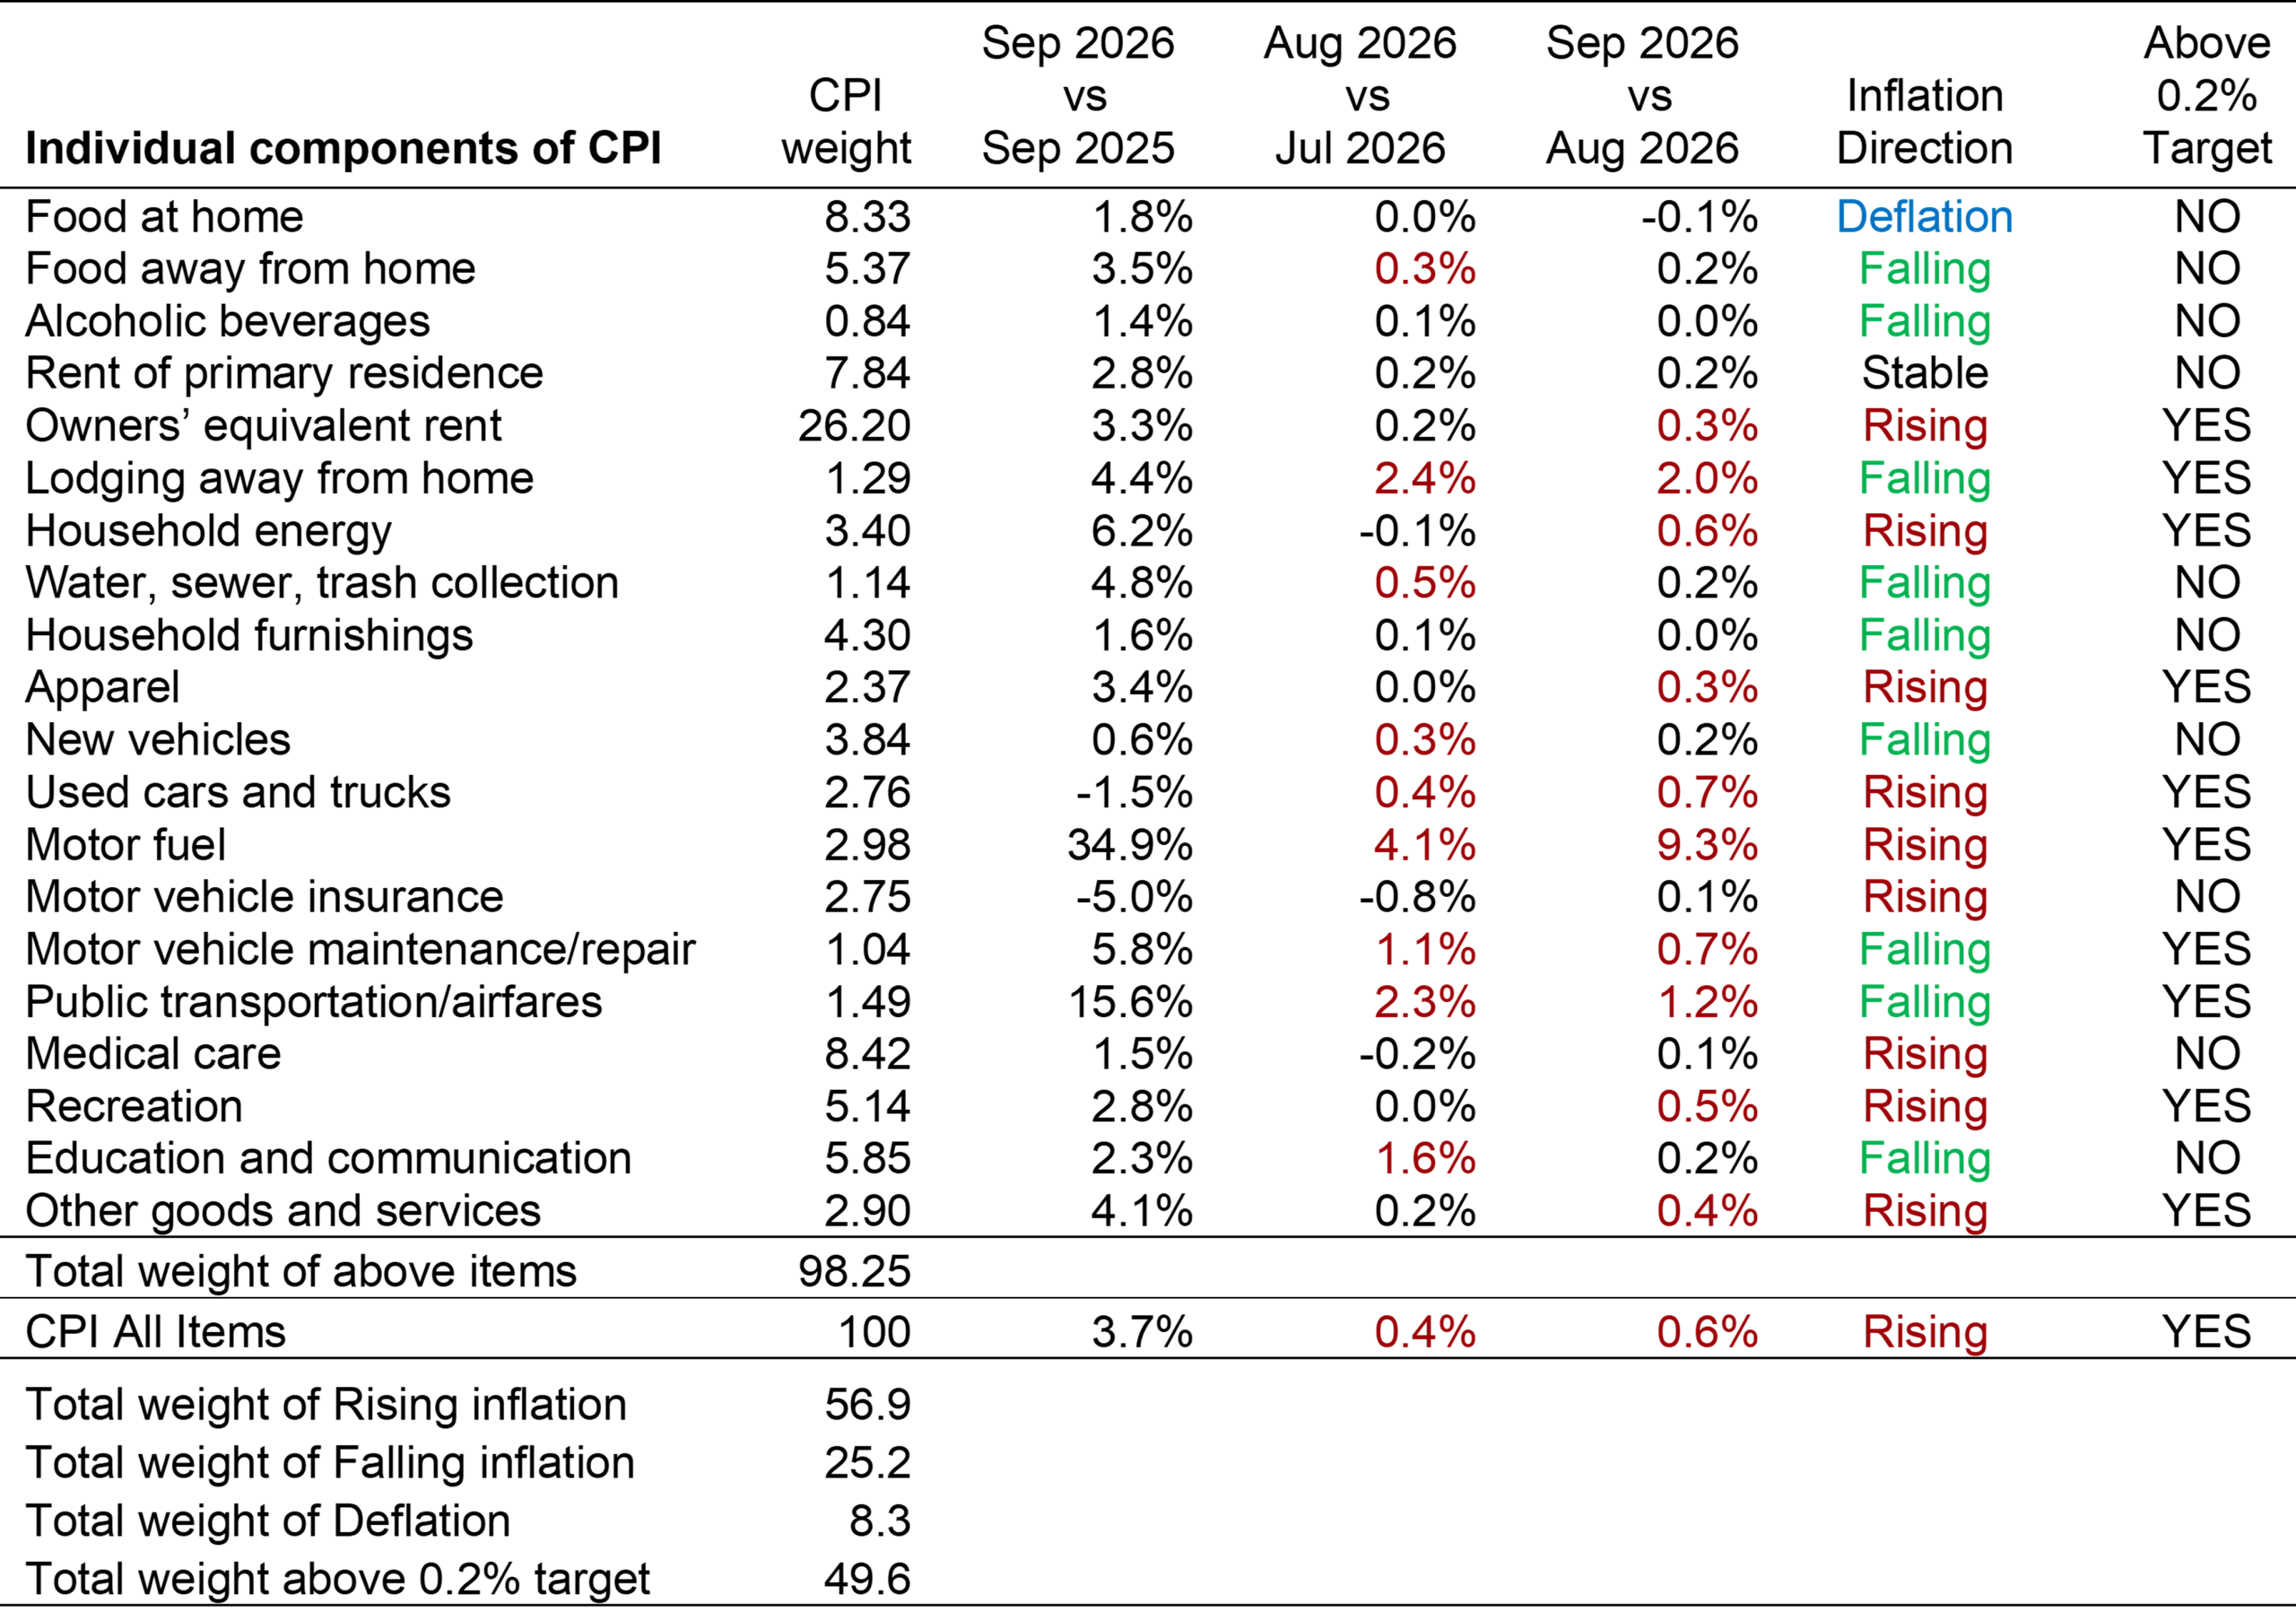
Sources: Bureau of Labor Statistics and RCF Calculations 1. Inflation direction indicates whether monthly inflation in September was higher or lower than monthly inflation in August. Deflation means prices fell in September vs August.
Highlights:
- Motor fuel prices increased 9% in September following a 4% increase in August. They are now up 35% year on year. The national average price for a gallon of regular gasoline is $4.33, according to AAA Fuel Prices, and diesel hit a high of $6.53 in September, up from a low this year of $3.46 in January (EIA). Public transportation/airfares, for which fuel is a major input, are up 16% from a year ago.
- Household energy prices rose 0.6% for the month and are up 6% for the year. Electricity prices are up 4% for the year, and utility gas prices are up 5%. Household fuel oil is up 15% for the month and up 74% for the year.
- New vehicles are up 0.2% for the month and up a modest 0.6% for the year. Used cars and trucks are up 0.7%, but down 1.5% for the year. Motor vehicle insurance prices are up 0.1% after falling for the last four months, and are down 5% for the year.
- Food at home prices fell 0.1% for the month and were the only major group to see falling prices. They are up 1.8% for the year. Food away from home is up 0.2% in September, and up 3.5% for the year.
- Rent and owner’s equivalent rent are up 0.2% and 0.3% respectively in September. Year over year, they are both up 3%. Lodging away from home is up 4% for the year, and up 2% for the month.
