Our guide to notable economic data, forecasts, and analyses. For more information contact Peter Bernstein at pbernstein@rcfecon.com. Additional updates and releases can be found at www.rcfecon.com/research/news-and-press-releases/
- Census Bureau, Advance Monthly Sales for Retail and Food Services, March 2021
- Federal Reserve, Industrial Production and Capacity Utilization, March 2021
- University of Michigan, Consumer Sentiment, April 2021 (preliminary)
- Conference Board, Consumer Confidence Index, April 2021
- S&P CoreLogic Case-Shiller Index, February 2021
- National Association of Business Economics, Business Conditions Survey, April 2021
- Yelp, Q1 Economic Average Report
- White House Briefing Room Blog, The Pandemics Effect on Measured Wage Growth
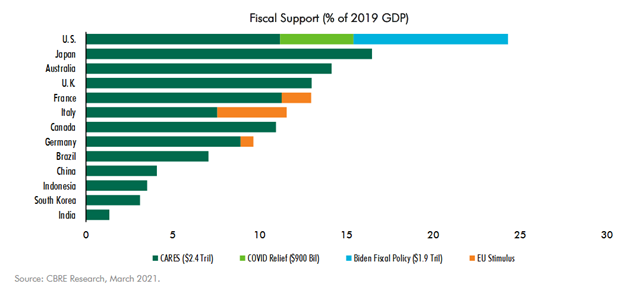
- Chart of the Week – Fiscal Support by Country
Data Releases
Census Bureau, Advance Monthly Sales for Retail and Food Services, March 2021
“Advance estimates of U.S. retail and food services sales for March2021, adjusted for seasonal variation and holiday and trading-day differences, but not for price changes, were $619.1billion, an increase of 9.8percent (±0.5 percent) from the previous month, and 27.7percent (±0.7 percent) above March 2020. Total sales for the January 2021 through March 2021 period were up 14.3percent (±0.5 percent) from the same period a year ago. The January 2021 to February 2021 percent change was revised from down 3.0 percent (±0.5 percent) to down2.7 percent (±0.2 percent).” https://www.census.gov/retail/marts/www/marts_current.pdf
Federal Reserve, Industrial Production and Capacity Utilization, March 2021
“In March, total industrial production increased 1.4 percent. The gain in March followed a drop of 2.6 percent in February, which largely resulted from widespread outages related to severe winter weather in the south central region of the country. For the first quarter as a whole, total industrial production rose 2.5 percent at an annual rate. In March, manufacturing production and mining output increased 2.7 percent and 5.7 percent, respectively. The output of utilities dropped 11.4 percent, as the demand for heating fell because of a swing in temperatures from an unseasonably cold February to an unseasonably warm March.” https://www.federalreserve.gov/releases/g17/current/
University of Michigan, Consumer Sentiment, April 2021 (preliminary)
“Stimulus checks, rising coronavirus vaccinations and a rapidly growing economy lifted the spirits of Americans in early April and pushed a closely followed survey of consumer attitudes to a 13-month high.
The consumer sentiment index rose to 86.5 in April from 84.9 in the prior month, according to a preliminary survey by the University of Michigan. That’s the highest level since the pandemic erupted in the U.S. in March 2020. The index had touched a 16-year high of 101 just a month earlier. https://www.marketwatch.com/story/americans-are-feeling-the-best-theyve-felt-since-the-pandemic-began-consumer-survey-shows-11618582769
Conference Board, Consumer Confidence Index, April 2021
“The Conference Board Consumer Confidence Index® rose sharply again in April, following a substantial gain in March. The Index now stands at 121.7 (1985=100), up from 109.0 in March. The Present Situation Index—based on consumers’ assessment of current business and labor market conditions—soared from 110.1 to 139.6. The Expectations Index—based on consumers’ short-term outlook for income, business, and labor market conditions—rose moderately, from 108.3 last month to 109.8 in April.” https://www.conference-board.org/data/consumerconfidence.cfm
S&P CoreLogic Case-Shiller Index, February 2021
“The S&P CoreLogic Case-Shiller U.S. National Home Price NSA Index, covering all nine U.S. census divisions, reported a 12.0% annual gain in February, up from 11.2% in the previous month. The 10-City Composite annual increase came in at 11.7%, up from 10.9% in the previous month. The 20-City Composite posted an 11.9% year-over-year gain, up from 11.1% in the previous month.” https://www.spglobal.com/spdji/en/index-announcements/article/sp-corelogic-case-shiller-index-reports-12-annual-home-price-gain-in-february-2021/
Economic Forecasts and Analyses
National Association of Business Economics, Business Conditions Survey, April 2021
“Results of the April NABE Business Conditions Survey show that conditions continued to improve during the first quarter of 2021. Two thirds of panelists indicate that the vaccine rollout and the new administration have had a positive impact on their view of the economy,” said NABE President Manuel Balmaseda, CBE, chief economist, CEMEX. “This optimism is broad-based by sector. Furthermore, respondents see a stronger outlook for growth in inflation-adjusted gross domestic product, or real GDP, over the year ahead than they expected three months ago. Thirty-five percent of panelists anticipate real GDP to expand by at least 6% from the first quarter of 2021 through the first quarter of 2022. That’s an increase from just 5% of panelists in the January survey who expected growth in calendar year 2021 to equal 6% or more.” https://nabe.com/NABE/Surveys/Business_Conditions_Surveys/April-2021-Business-Conditions-Survey-Summary.aspx
Yelp, Q1 Economic Average Report
Key Points from https://www.yelpeconomicaverage.com/yea-q1-2021.html
- New business openings in Q1 hit highest level over the last year
- New business openings increase in states with decreased pandemic restrictions
- Business reopenings rise across the country in Q1, reach highest levels since summer 2020
- Consumer interest begins to return to pre-pandemic activities
White House Briefing Room Blog, The Pandemics Effect on Measured Wage Growth
Conclusion: “Average wages are being shaped by a number of different factors right now, including but not limited to composition and base effects in wages. It is possible that headline average wage growth estimates will be negative in coming months. However, those negative estimates would reflect composition and base effects depressing the average wage, rather than wage cuts for workers. The Administration is paying close attention to how these influences are affecting the economic data. As the economy returns to normal we expect these anomalies to gradually disappear.” https://www.whitehouse.gov/briefing-room/blog/2021/04/19/the-pandemics-effect-on-measured-wage-growth/
CBRE, “COVID–19 Impact on Resident Migration Patterns”
- As the COVID-19 crisis escalated and social-distancing restrictions took hold, the outflow of people from dense, high-cost urban metros accelerated in 2020.
- Sun Belt metros and those in interior parts of the country either gained new residents or had fewer people leave relative to 2019.
- While some metros fared better than others, nearly all urban centers saw an increase in move-outs. Nationally, urban centers had 15% more move-outs in 2020 than in 2019, according to CBRE’s analysis of U.S. Postal Service (USPS) data.
- Most of the moves in the pandemic were short-to-moderate distances, often to nearby counties.
- The biggest cohort of this urban outflow is affluent young adults who are well-educated, childless and can work remotely.
- The outflow from urban areas likely will subside as normal life resumes and lower rents lure back some who had moved out
Chart of the Week – Fiscal Support by Country
Relative to 2019 GDP, the United States’ fiscal response to the COVID-19 pandemic has been significant. The chart of the week is from CBRE’s recent Global Economic Outlook.